
Unit 2: Kinematics — Notes
2.1 Rest And Motion
2.2 Types Of Motion
Long Questions
Q1. Define rest and motion and explain them as relative quantities.
REST AND MOTION
We see various things around us. Some of them are at rest while others are in motion
Rest:
“A body is said to be at rest, if it does not change its position with respect to its surroundings.”
Surroundings:
Surroundings are the places in its neighbourhood where various objects are present.
Motion:
“A body is said to be in motion, if it changes its position with respect to its surroundings.”
Relative Quantities:
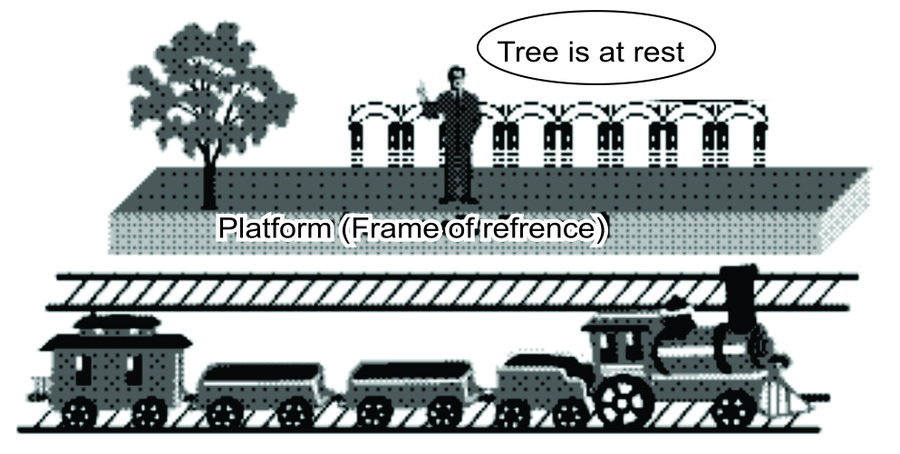
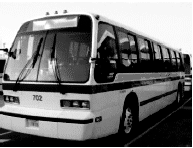
The state of rest or motion of a body is relative. For example, a passenger sitting in a moving bus is at rest because he/she is not changing his/her position with respect to the other passengers sitting in the bus. But to an observer outside the bus, the passengers and objects inside the bus are in motion because they are changing their positions.
Q2. Define Translatory motion and its types. (LHR 2011, 2012, 2013 GRW 2013, 2015)


TRANSLATORY MOTION
Introduction:
Everything in this universe is in motion. However different objects move differently.
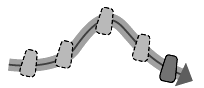
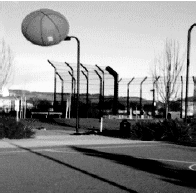
Some objects move along a straight line, some move in curved path, and some move in some other way.
Definition:
“In translational motion, a body moves along a line without any rotation. The line may be straight or curved.”
Examples:
Following are some examples of translatory motion:
Motion of a car in straight line
Motion of electron around the nucleus
Motion of gas molecules
Aero plane moving straight is in translational motion
TYPES OF TRANSLATORY MOTION
There are three types of translatory motion.
Linear Motion (LHR 2014)
Circular Motion
Random Motion (LHR 2013, 2014)
LINEAR MOTION
Definition:
“Straight line motion of a body is known as its linear motion.”
Examples:
Following are some examples of linear motion:
The motion of freely falling bodies.
Motion of a car on a straight and leveled road.
Motion of aeroplanes flying straight in air.
CIRCULAR MOTION
Definition:
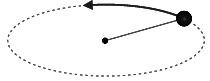
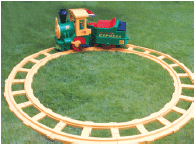
“The motion of an object in a circular path is known as circular motion.”
Examples:
Some examples of circular motion are given below:
A stone tied with string, when whirled, it will move along a circular path.
A toy train moving on a circular track.
Motion of individual particle of spinning top.
Earth moving around the sun in solar system
Motion of moon around the Earth.
Motion of a bicycle or a car moving along circular road.
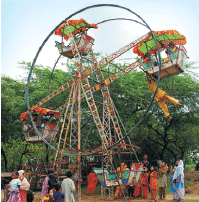
Motion of a rider in Ferris wheel.
RANDOM MOTION
Definition:
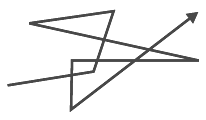
“The disordered or irregular motion of an object is called random motion.”
Examples:
The motion of insects and birds.
Brownian motion of gas or liquid molecules along a zig–zag path.
Motion of dust or smoke particles in air
Short Questions
Q1. Define mechanics? Write its branches
MECHANICS
Definition:
“The branch of physics in which we study motion of objects its causes and effects is called mechanics”
Branches of Mechanics:
There are two branches of mechanics
Kinematics
Dynamics
Kinematics: (GRW 2015)
“The branch of mechanics that deals with the study of motion of an object without discussing the cause of motion is called kinematics.”
Dynamics: (GRW 2015)
“The branch of mechanics that deals with the study of motion of an object and the cause of its motion is called dynamics.”
Q2. Write about different types of motion.


TYPES OF MOTION
There are three types of motion:
Translatory Motion
Rotatory Motion
Vibratory Motion
Translatory Motion:
“In translational motion, a body moves along a line without any rotation. The line may be straight or curved.”
Examples:
Following are some examples of translatory motion:
Motion of a car in straight line
Motion of electron around the nucleus
Motion of gas molecules
Types of Translatory Motion:
There are three types of translatory motion.
Linear Motion
Circular Motion
Random Motion
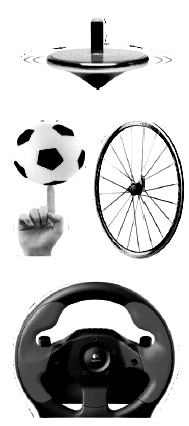
Rotatory Motion: (LHR 2013)
“The spinning motion of a body around its axis is called its rotatory motion.”
Examples:
Following are some examples of rotatory motion:
Motion of spinning top
Motion of the Earth around its geographical axis
Motion of wheel and steering wheel around its axis
Motion of a ceiling electric fan
Motion of Ferris wheel
Vibratory Motion: (LHR 2011, GRW 2015)
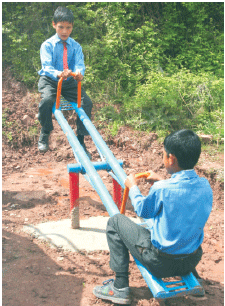
“To and fro motion of a body about its mean position is known as vibratory motion.”
Examples:
Some examples of vibratory motion are as follows:
Motion of swing back and forth about its mean position
Motion of pendulum of wall clock
Motion of see – saw
Motion of a body attached with a spring.
Motion of hammer of ringing electric bell.
Motion of string of a sitar
Motion of a baby in a cradle moving to and fro
Q3. Define Axis of rotation
AXIS OF ROTATION
Definition:
“An axis is a line around which a body rotates.”
Position:
In case of rotatory motion the Axis passes through the body while in case of circulatory motion the axis is present out–side the body.
Q4. Differentiate between circular motion and rotatory motion. (GRW 2015)
DIFFERENTIATION
Differences between circulatory and rotatory motion are as follows:
| Circulatory Motion | Rotatory Motion |
| Definition | Definition |
| The motion of an object in a circular path is known as circular motion. | The spinning motion of a body about its axis is called rotatory motion. |
| Position of Axis | Position of Axis |
| In circular motion the point about which a body goes around is outside the body. | In rotatory motion the line around which a body moves about is passing through the body itself. |
| Examples | Examples |
| Motion of earth around the sun. Motion of individual particles of spinning top Motion of rider in Ferris Wheel |
Motion of earth about its geographical axis. Spinning motion of top Motion of Ferris Wheel |
Q5. When a body is said to be at rest? (Mini exercise Pg. # 32)
A BODY AT REST
When a body does not change its position with respect to its surroundings, then it is said to be in the state of rest.
Example:
A tree standing along a road is in the state of rest with respect to that road.
Q6. Give an example of a body that is at rest and is in motion at the same time.
REST AND IN MOTION AT SAME TIME
If a person is sitting in a moving car, he will be in the state of rest with respect to the other person sitting in the car and he will be in the state of motion with respect to the person standing on the road side at the same time.
Q7. Mention the type of motion in each of the following. (Mini exercise Pg. # 32)
TYPES OF MOTION
| Sr. # | Motion | Type |
| I | A ball moving vertically upward | Linear motion (Translatory motion) |
| ii | A child moving down a slide | Linear motion (Translatory motion) |
| iii | Movement of a player in a football ground | Random motion (Translatory motion) |
| iv | The flight of a butterfly | Random motion (Translatory motion) |
| V | An athlete running in a circular track | Circular motion (Translatory motion) |
| vi | The motion of a wheel | Rotatory motion |
| vii | The motion of a cradle | Vibratory motion |
2.3 Scalars And Vectors
2.4 Terms Associated With Motion
Short Questions
Q1. Differentiate scalar and vector quantities. (LHR 2014, 2015, 2017)
DIFFERENTIATION
Differences between scalar and vectors are as follows:
| Scalar Quantities | Vector Quantities |
| Definition | Definition |
| Physical quantities which can be completely described by their magnitude only are called scalar quantities or simply Scalars | Physical quantities which can be completely described by their magnitude along with their direction are called vector quantities or simply Vectors. |
| Addition/Subtraction | Addition/Subtraction |
| Scalar quantities can be added or subtracted by simple arithmetic rules because they have only numeric value with proper unit. | Vector quantities can–not be added or subtracted by simple arithmetic rules because they have direction along with numeric value and proper unit. They need head to tail rule for this purpose |
| Examples | Examples |
| Mass, length, time speed, volume, area, energy etc. | Velocity, force, displacement, momentum, torque etc. |
Q2. Define Magnitude.
MAGNITUDE
Definition:
“The magnitude of a quantity means its numeric value with appropriate unit.”
Examples:
2.5 kg, 40s, 1.8m etc. represent magnitudes of different physical quantities.
Q3. Justify the need of direction for a vector quantity.
NEED OF DIRECTION
It would be meaningless to describe vectors without direction. For example, distance of a place from reference point is insufficient to locate that place. The direction of that place from reference point is also necessary to locate it.
Example of Forces:
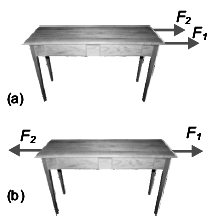
Consider a table as shown in figure below:
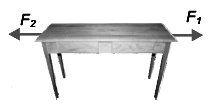
Two forces F1 and F2 are acting on it. It will make lot of difference if the two forces act in opposite direction such as indicated in figure below:
Certainly the two situations differ from each other. They differ due to the direction of the forces acting on the table. Thus the description of a force would be incomplete if direction is not given. Similarly, when we say, we are walking at the rate of 3 kmh–1 towards north then we are talking about a vector.
Q4. How a vector is represented? (LHR 2014)

REPRESENTATION OF VECTORS
A vector quantity can be represented by two methods
Symbolic Method
Graphical Method
SYMBOLIC REPRESENTATION
To differentiate a vector from a scalar quantity we generally use bold letters to represent vector quantities. Such as F, a, d or a bar or arrow over their symbols such as
GRAPHICAL REPRESENTATION (LHR 2014, GRW 2014)
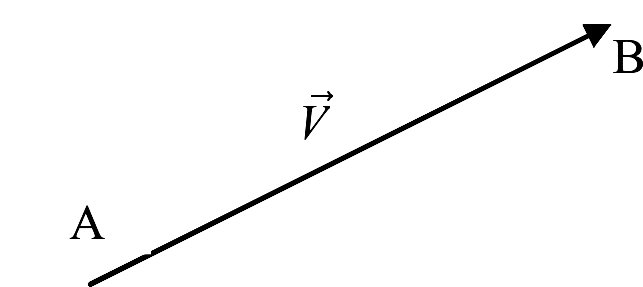
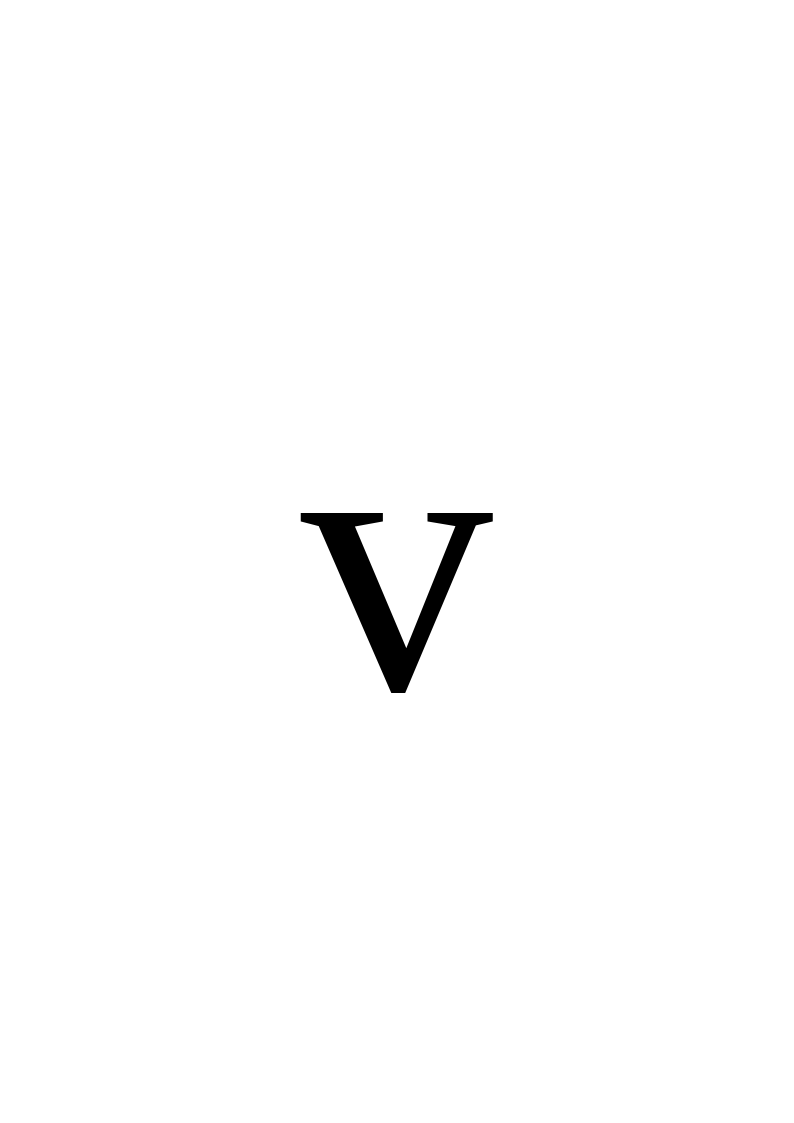
Graphically, a vector can be represented by a line segment with an arrow head. In figure below, the line AB with arrow head at B represents a vector V. The length of the line AB gives the magnitude of the vector V on a selected scale. While the direction of the line from A to B gives the direction of the vector V.
Q5. Why vector quantities cannot be added and subtracted like scalar quantities? (Exercise 2.11)
ADDITION AND SUBTRACTION OF VECTORS
Scalar quantities can be described completely by magnitude only and can be added or subtracted by simple arithmetic rules. Vector quantities in addition to magnitude also need direction for their description. So vectors cannot be added or subtracted by arithmetic rules due to direction.
Q6. How are vector quantities important to us in our daily life?
IMPORTANCE OF VECTOR QUANTITIES
In order to locate a place from a reference point, we will have to describe the distance and direction of that place from reference point. Description of distance along with direction will make up a vector quantity. Hence by using vector quantities we can describe the position (or location) of bodies.
Q7. What is Position? (GRW 2015)
POSITION
Definition:
“The term position describes the location of a place or a point with respect to some reference point called origin”.
Quantity:
Position is a vector quantity. Change in position is called displacement.
Example:
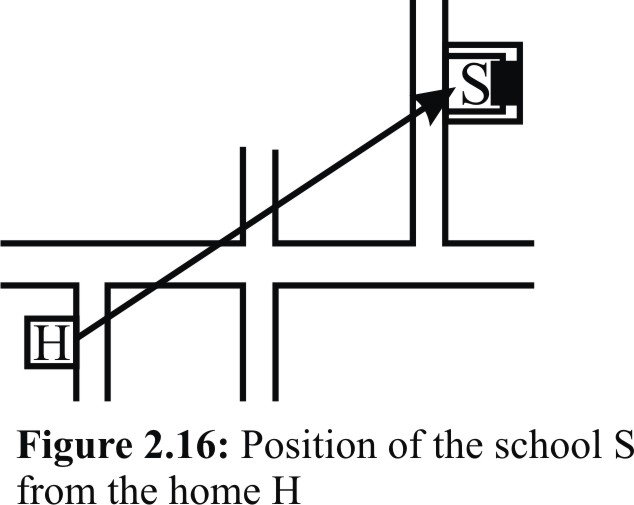
For example you want to describe the position of your school from your home. Let the school be represented by S and home by H. The position of your school from your home will be represented by a straight line HS in the direction from H to S as shown in figure.
Q8. Define Origin?
ORIGIN
Definition:
“The fixed point that is used as reference point to locate the position of an object or point is called origin.”
Origin is also termed as reference point and it is denoted by “O
Q9. Differentiate Distance and displacement? (LHR 2017)

DIFFERENTIATION
Differences between distance and displacement are as follows
| Distance | Displacement |
| Definition | Definition |
| Length of path between two points is called distance between those points. | The shortest distance between two points which has magnitude and direction is called displacement |
| Symbol | Symbol |
| Distance is represented by “S” | Displacement is denoted by “” |
| Quantity | Quantity |
| Distance is a scalar quantity. Its S.I unit is metre | Displacement is a vector quantity. Its S.I unit is metre |
| Graphical Difference | Graphical Difference |
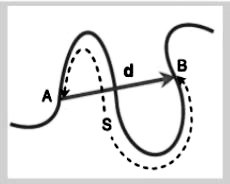
| Consider a body that moves from point A to point B along the curved path. Join points A and B by a straight line. The straight line AB gives the distance which is the shortest between A and B. This shortest distance has magnitude d and direction from point A to B. This shortest distance d in a particular direction is called displacement. While any other length of path between A and B shows distance. | Consider a body that moves from point A to point B along the curved path. Join points A and B by a straight line. The straight line AB gives the distance which is the shortest between A and B. This shortest distance has magnitude d and direction from point A to B. This shortest distance d in a particular direction is called displacement. While any other length of path between A and B shows distance. |
Q10. Differentiate Speed and Velocity?

DIFFERENTIATION
Differences between speed and velocity are as follows:
| Speed | Velocity |
| Definition | Definition |
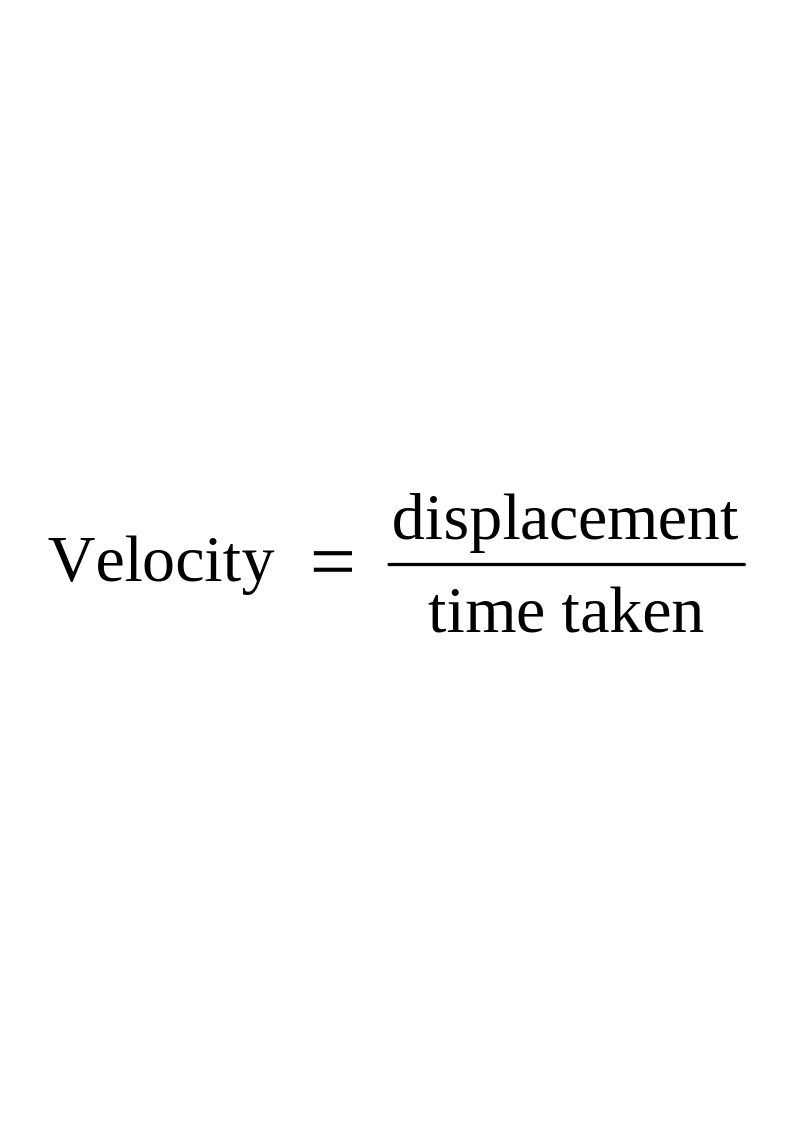
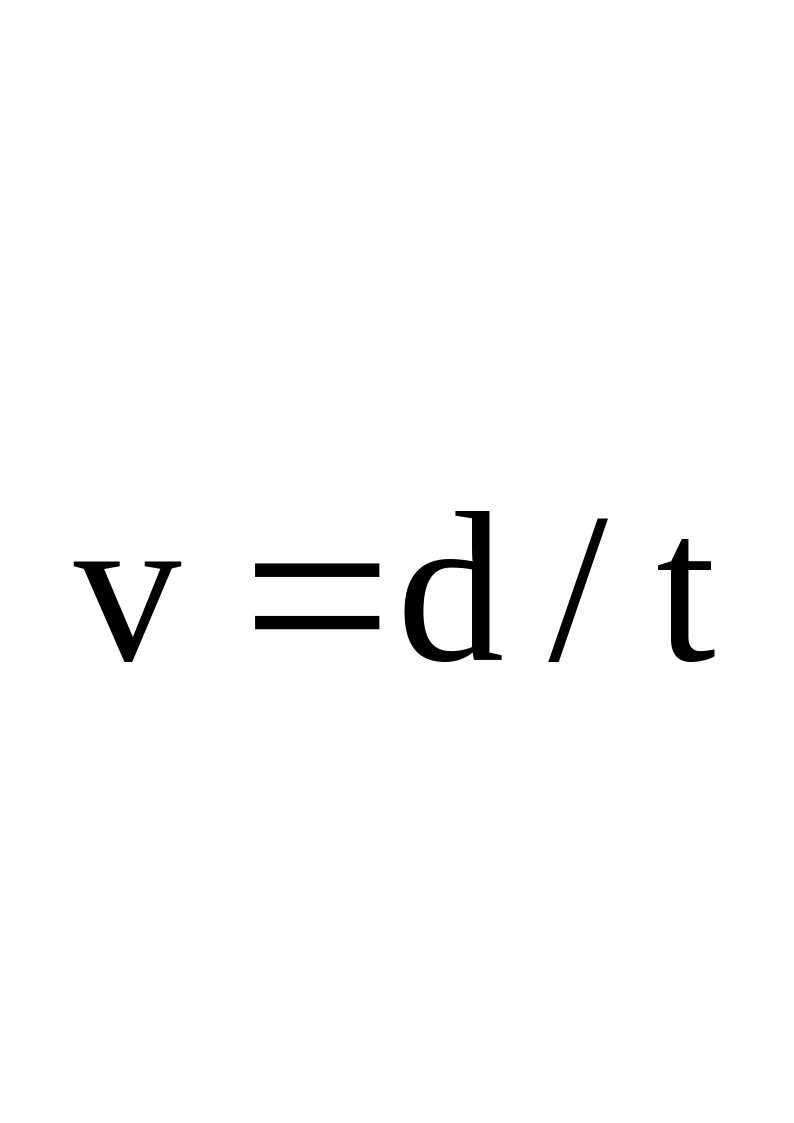
| The distance covered by an object in unit time is called speed | The rate of displacement of a body is called its velocity. |
| Symbol | Symbol |
| Speed is represented by “v” | Displacement is denoted by “” |
| Quantity | Quantity |
| Speed is a scalar quantity. Its S.I unit is metre per second (ms–1) | Speed is a scalar quantity. Its S.I unit is metre per second (ms–1) |
| Formula | Formula |
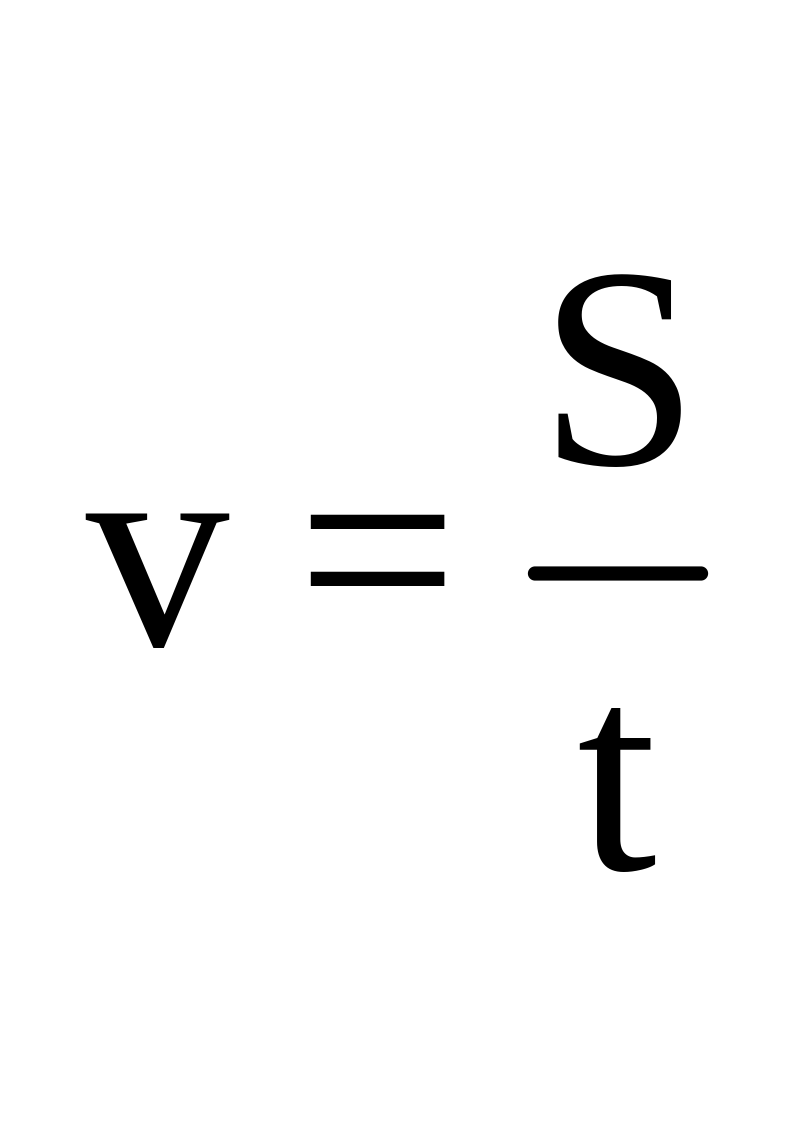
| Speed= Distance covered/Total time |
Q11. How you will define the uniform speed? (GRW 2013)
UNIFORM SPEED
Definition:
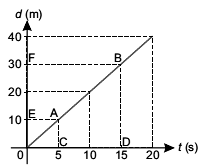
“If the speed of a body does not vary and has the same value then the body is said to possess uniform speed.”
OR
“A body has uniform speed if it covers equal distances in equal intervals of time however short the interval may be.”
In this case distance time graph will be a straight line inclined to time Axis.
Q12. Define variable speed.
VARIABLE SPEEED
Definition:
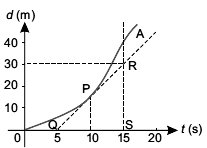
“If a body does not cover equal distances in equal intervals of time, however short the intervals may be, then the speed of the body is said to be variable.”
In this case distance time graph will not be a straight line
Q13. What do you know about uniform velocity? (GRW 2013, 2015)
UNIFORM VELOCITY
Introduction:
In many cases the speed and direction of a body does not change. In such a case the body possesses uniform velocity. That is the velocity of a body during any interval of time has the same magnitude and direction.
Definition:
“A body has uniform velocity if it covers equal displacement in equal intervals of time however short the intervals may be.”
Q14. Define variable velocity.
VARIABLE VELOCITY
Definition:
“If a body does not cover equal displacement in equal intervals of time, however short the intervals may be, then the velocity of the body is said to be variable.”
Q15. A body is moving with uniform speed. Will its velocity be uniform?
UNIFORM / VARIABLE VELOCITY
A body moving with uniform speed may have either uniform or variable velocity.
If the direction of the body is not changing then its velocity will also be uniform.
If the direction of the body is changing then its velocity will be variable.
Example 1
A car moving with uniform speed in the straight line will have uniform velocity. If the direction of the body is changing then its velocity will be variable.
Example 2
A car moving with uniform speed in the circular path will have variable velocity because its direction changes at every point on the circle.
Q16. Why a body moving along a circle with uniform speed has variable velocity?
VARIABLE VELOCITY ALONG CIRCULAR PATH
A body moving along a circle with uniform speed has variable velocity because its direction is changing at every point on the circular path.
Q17. Does speedometer of a car measure its velocity?
SPEED–O–METER
The speedometer of a car measures only magnitude of velocity not the direction. Therefore, we can say that speedometer of the car does not measure its velocity. It measures only speed.
Q18. When does a body possess acceleration?
Acceleration
In many cases the velocity of a body changes due to a change either in its magnitude or direction or both. The change in the velocity of a body causes acceleration in it. If there is no change in the velocity of a body there will be no acceleration in it that is why a body moving with constant velocity does not have acceleration.
Q19. What is meant by the acceleration? (LHR 2015, GRW 2017)
ACCELERATION
Definition:
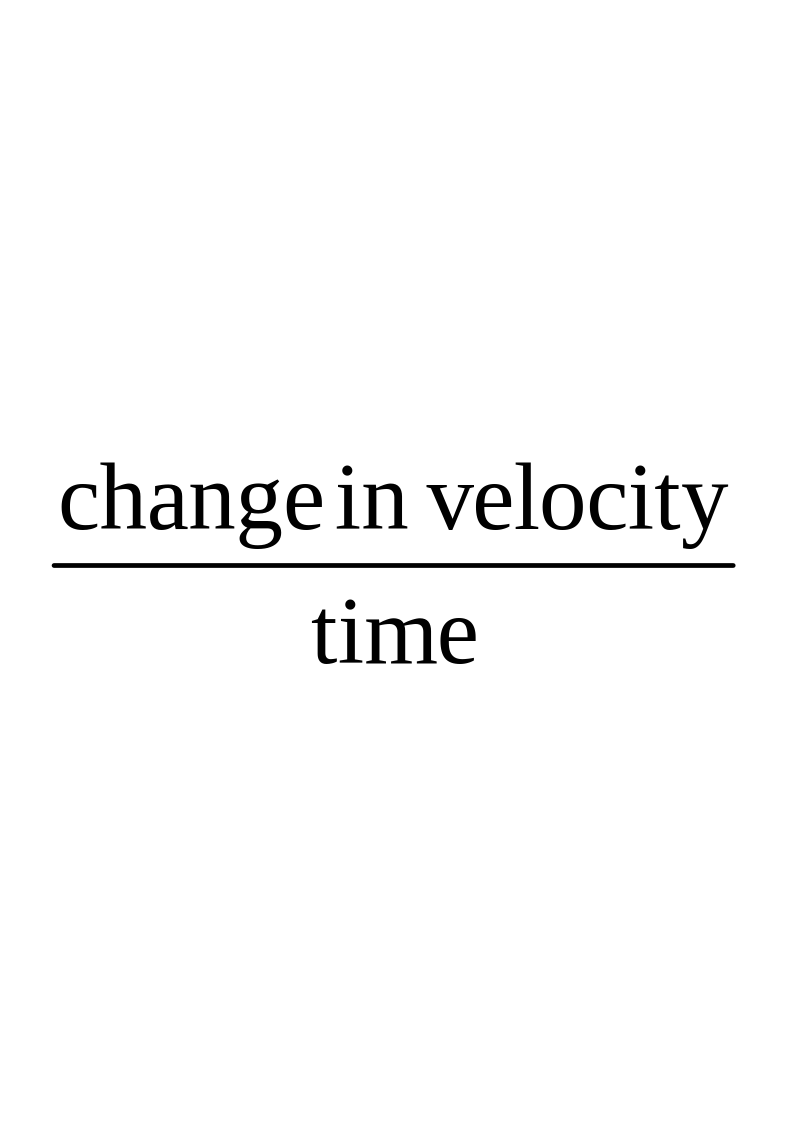
“The rate of change of velocity of a body is known as acceleration.”
Mathematical Form:
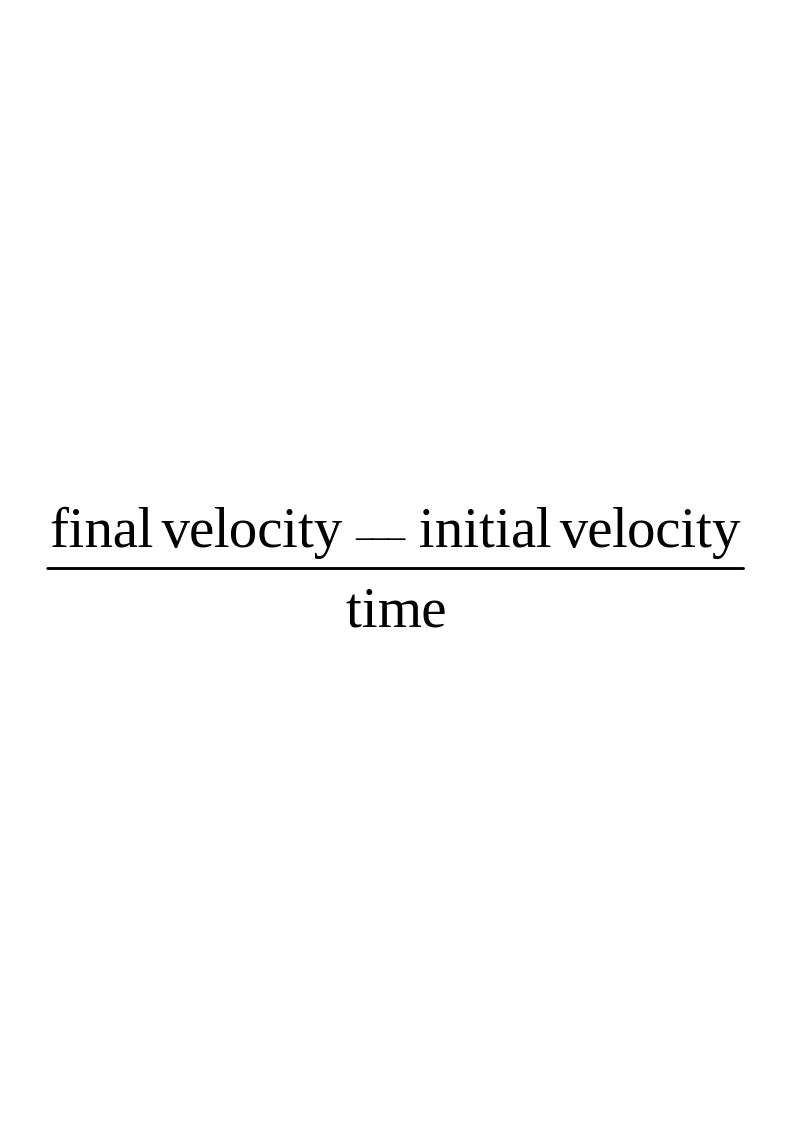
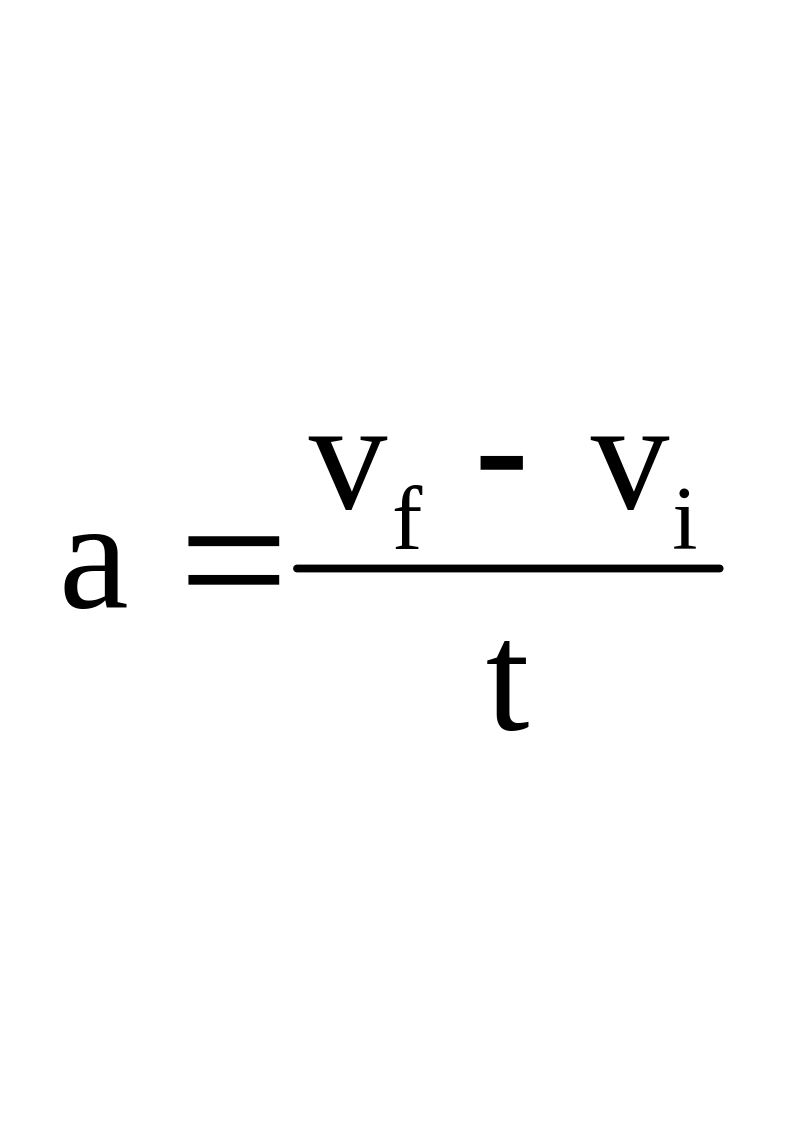
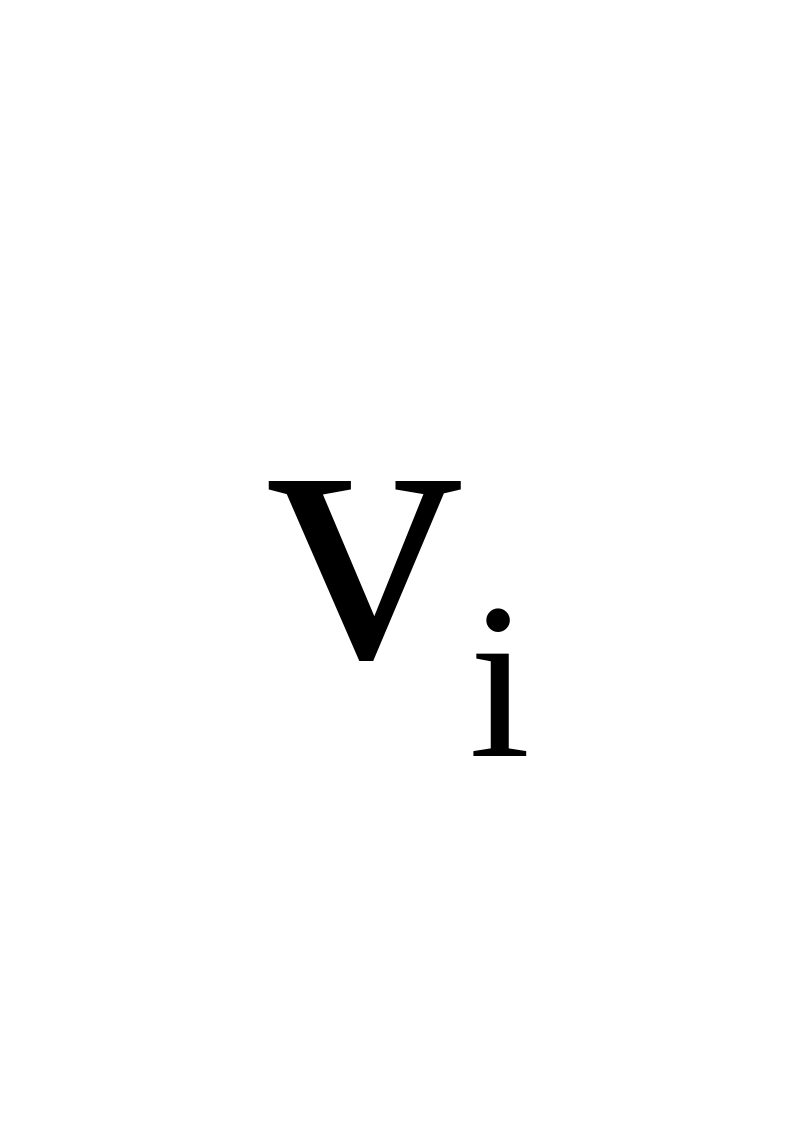
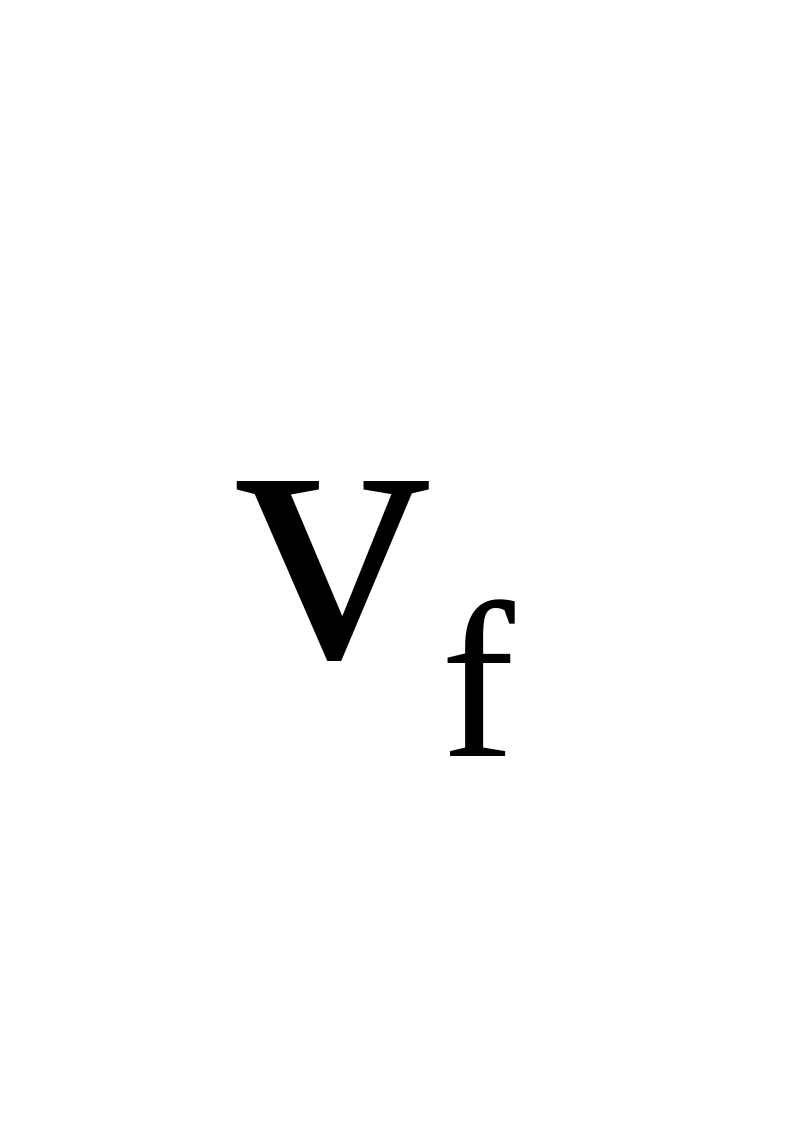
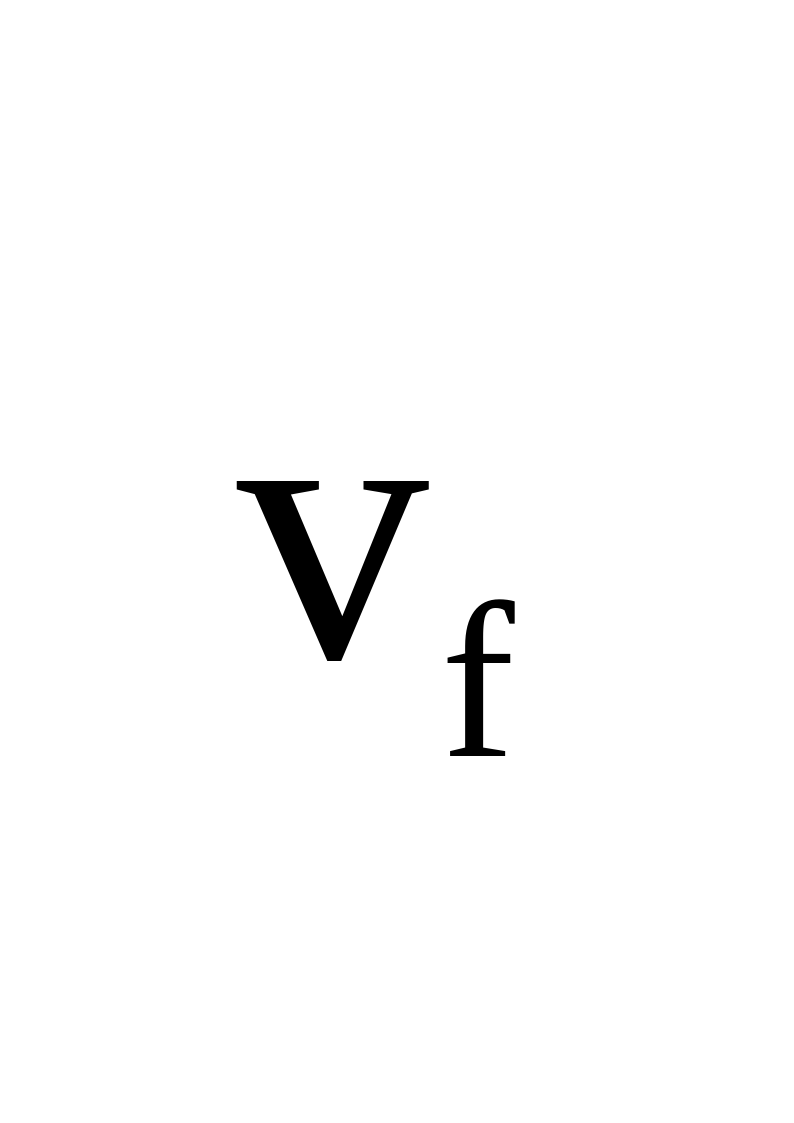
If a body is moving with initial velocity ’vi’ and after some time ‘t’ its velocity becomes ‘vf’ then change in velocity will be vf–vi in time t.
Acceleration =
Acceleration =
So,
Unit:
SI unit of acceleration is meter per second per second (ms–2).
Quantity:
It is a vector quantity.
Q20. Define uniform acceleration? (LHR 2017)
UNIFORM ACCELERATION
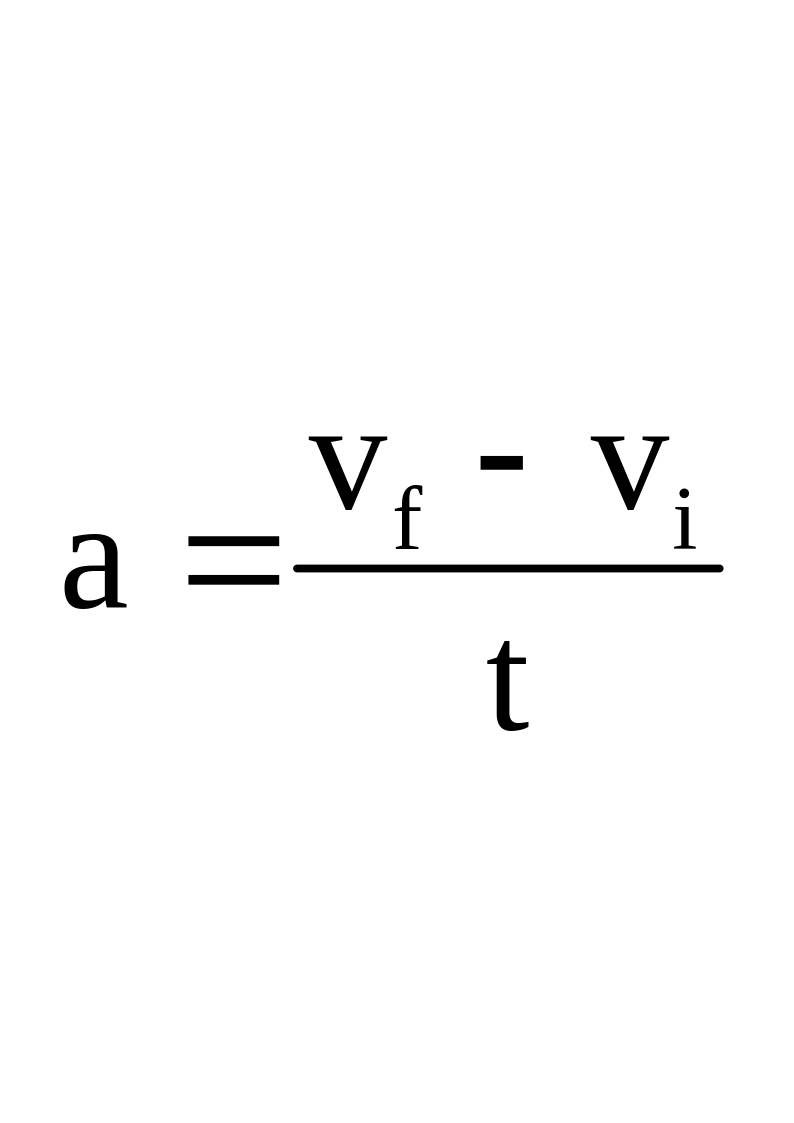
We know,
Let the time t is divided into many smaller intervals of time. If the rate of change of velocity during all these intervals remains constant then the acceleration a also remains constant. Such a body is said to possess uniform acceleration.
Definition:
“A body has uniform acceleration if it has equal changes in velocity in equal intervals of time however short the interval maybe.”
Q21. Define variable acceleration.
VARIABLE ACCELERATION
If a body does not have equal changes in velocity in equal intervals of time, however small the intervals may be, then the acceleration of the body is said to be uniform.
Q22. What is meant by positive acceleration and negative acceleration? (GRW2012, 2015)
POSITIVE ACCELERATION
If the velocity of the body is increasing then acceleration will be positive. The direction of positive acceleration is the same in which the body is moving without change in its direction.
Example:
If a car is moving in straight line and the driver presses the accelerator the velocity of the car starts to increase. So the acceleration of the body will be positive.
NEGATIVE ACCELERATION
If the velocity of the body is decreasing then acceleration will be negative. The direction of negative acceleration is opposite to the direction in which the body is moving. Negative acceleration is also called retardation or deceleration.
Example:
If the driver applies brake, the velocity will start to decrease. So acceleration of the body will be negative and direction of acceleration is opposite to the direction of velocity.
Q23. Can a body moving with constant velocity have acceleration? (LHR 2011, 2012, GRW 2017)
ZERO ACCELERATION
No, a body moving with constant velocity will not have acceleration; its acceleration will be zero because acceleration is defined as the rate of change of velocity. When the body is moving with uniform velocity, the change in velocity will be zero and therefore the acceleration will also be zero.
Q24. Can a body moving with certain velocity in the direction of east can have acceleration in the direction of west?
DIRECTION OF ACCELERATION
Yes, a body moving with certain velocity in the direction of east can have acceleration in the direction of west. It is the case when the velocity of the body decreases. When velocity decreases, acceleration is produced in opposite direction to the direction of motion.
Q25. Which is the fastest animal on the Earth? (Do you know Pg. # 35)
FASTEST ANIMAL
The fastest animal on the Earth is Falcon that can fly at the speed of 200kmh–1.
Q26. What is LIDAR GUN? (Do you know Pg. # 36)

LIDAR GUN
A LIDAR gun is light detection and ranging speed gun. It uses the time taken by laser pulse to make a series of measurements of a vehicle’s distance from the gun. The data is then used to calculate the vehicle’s speed. It is being used as motorway speed camera.
Q27. What is terminal velocity? (Do you know Pg. # 36)
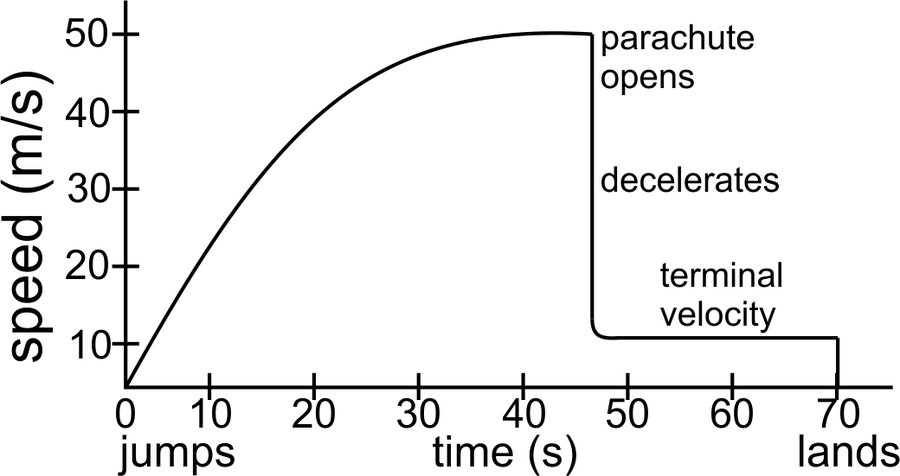
TERMINAL VELOCITY
The constant velocity of a body falling down with in gravitational field is called terminal velocity.
EXAMPLE 2.1
Q28. Represent a force of 80 N acting towards North of East.
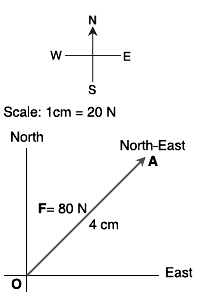
STEP # 1 SPECIFICATION OF DIRECTIONS
Draw two lines perpendicular to each other. Horizontal line represents East–West and vertical line represents North–South direction as shown in figure:
STEP # 2 SELECTION OF SUITABLE SCALE
Select a suitable scale to represent the given vector. In this case, we may take a scale which represents 20 N by 1 cm line.
STEP # 3 DRAWING REPRESENTATIVE LINES
Draw a line according to the scale in the direction of the vector. In this case, draw a line OA of length 4 cm along North–East.
STEP # 4 SHOWING DIRECTION
Put an arrow head at the end of the line. In this case, arrow head is at point A. Thus, the line OA will represent a vector i.e., the force of 80 N acting towards North–East.
EXAMPLE 2.2
Q29. A sprinter completes its 100 metre race in 12s. Find its average speed.
Given Data:
Total distance = S = 100m
Total time taken = t = 12s
To Find:
Average speed = Vav = ?
Calculations:
Average speed = Total distance moved / Total time taken
Vav = 100m/12s
Vav = 8.33ms–1
Result:
Hence, the average speed of the sprinter will be 8.33ms–1.
EXAMPLE 2.3
Q30. A cyclist completes half round of a circular track of radius 318 m in 1.5 minutes. Find its speed and velocity.
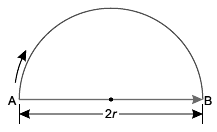
We can easily deduce given data by drawing figure:
Given Data:
Radius of the circle = r = 318m
Distance covered by the sprinter = S = πr
= (3.14)(318) = 999m
Displacement covered by the sprinter = d = 2r
=2 (318) = 636m
Time taken by the sprinter = t = 1.5 minutes
= 1.5 (60) = 90s
To Find:
Speed of the sprinter = v = ?
Velocity of the sprinter = = ?
Calculations:
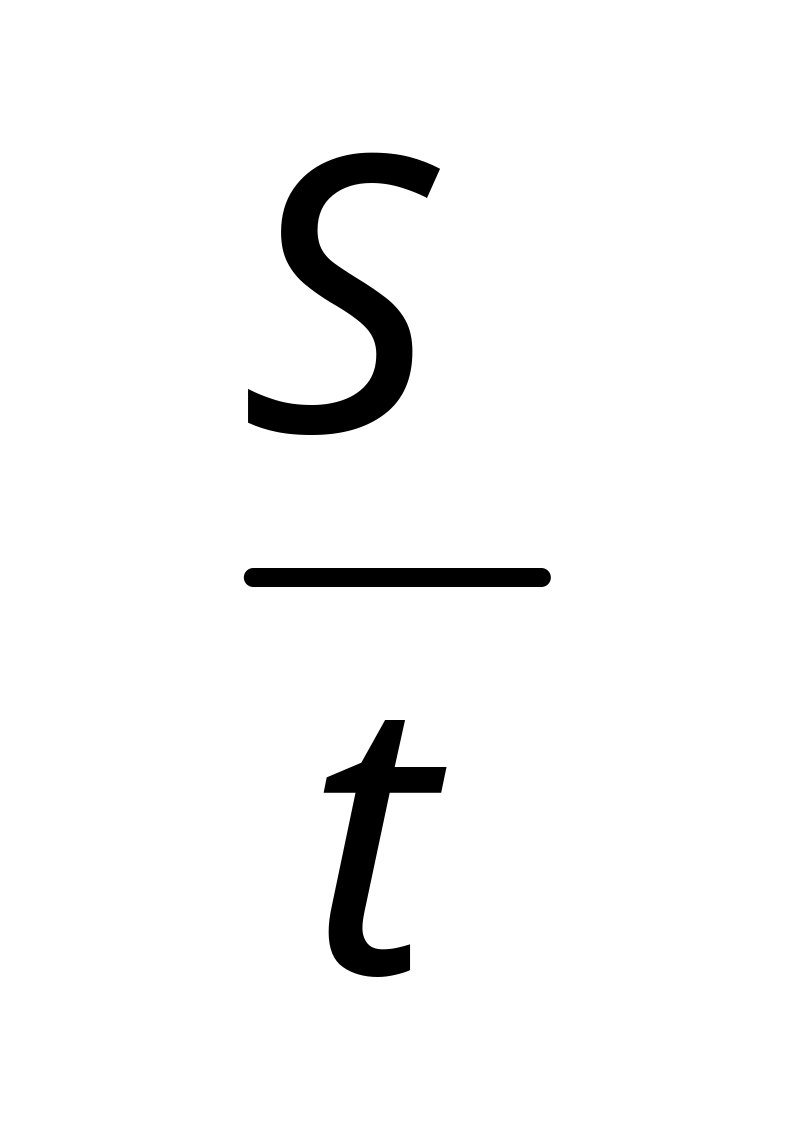
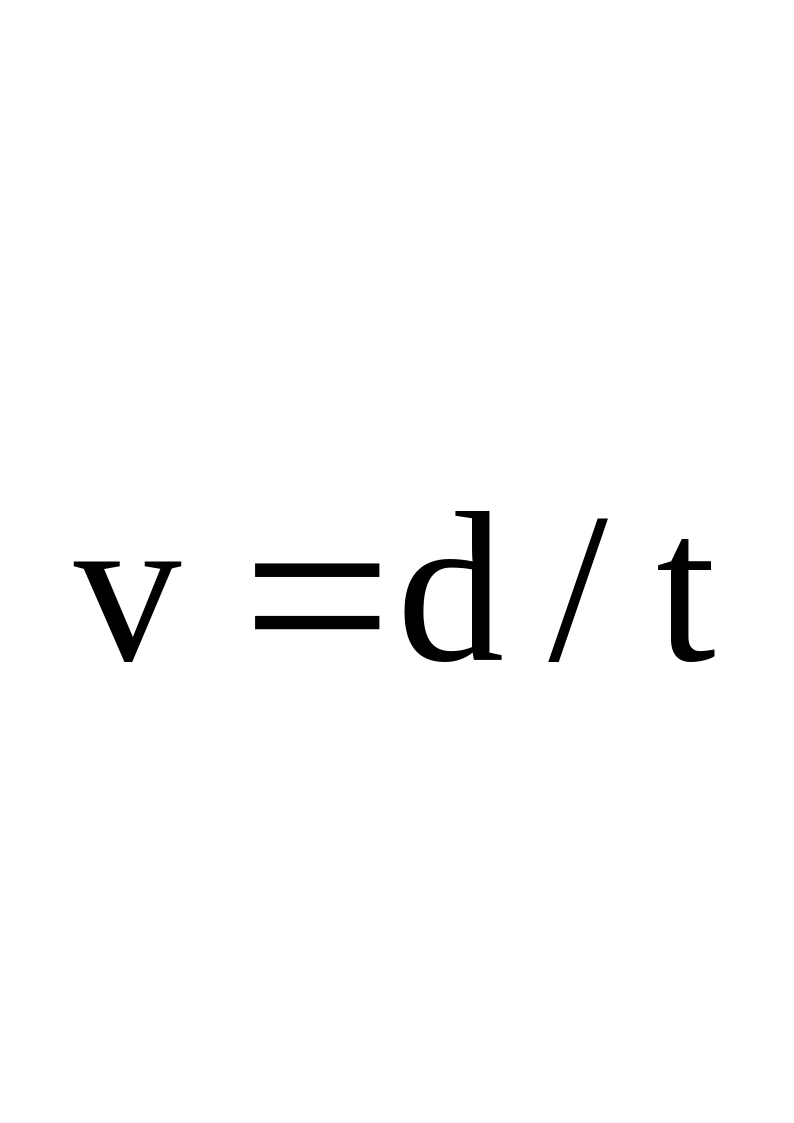
Speed= Distance covered/Total time
v =
Putting values
v = 999/90 = 11.1ms–1
Now we find velocity
Putting values
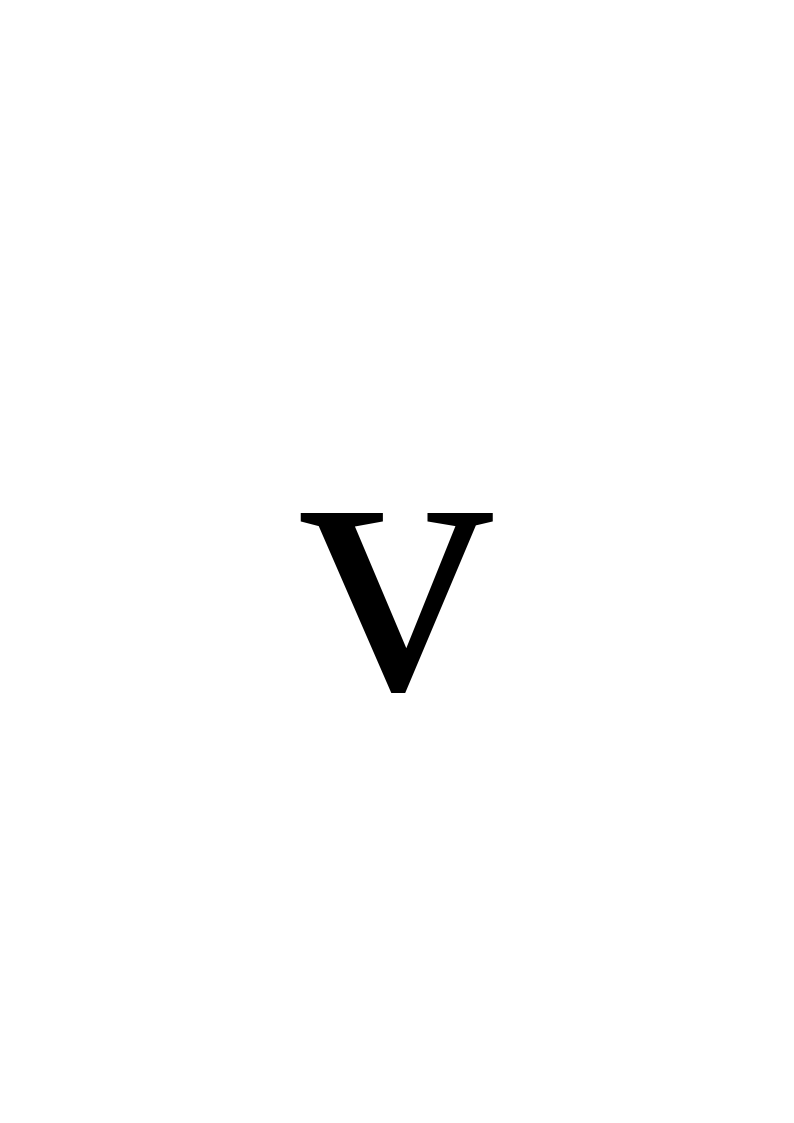
= 636 / 90 = 7.07 ms–1
Result:
EXAMPLE 2.4
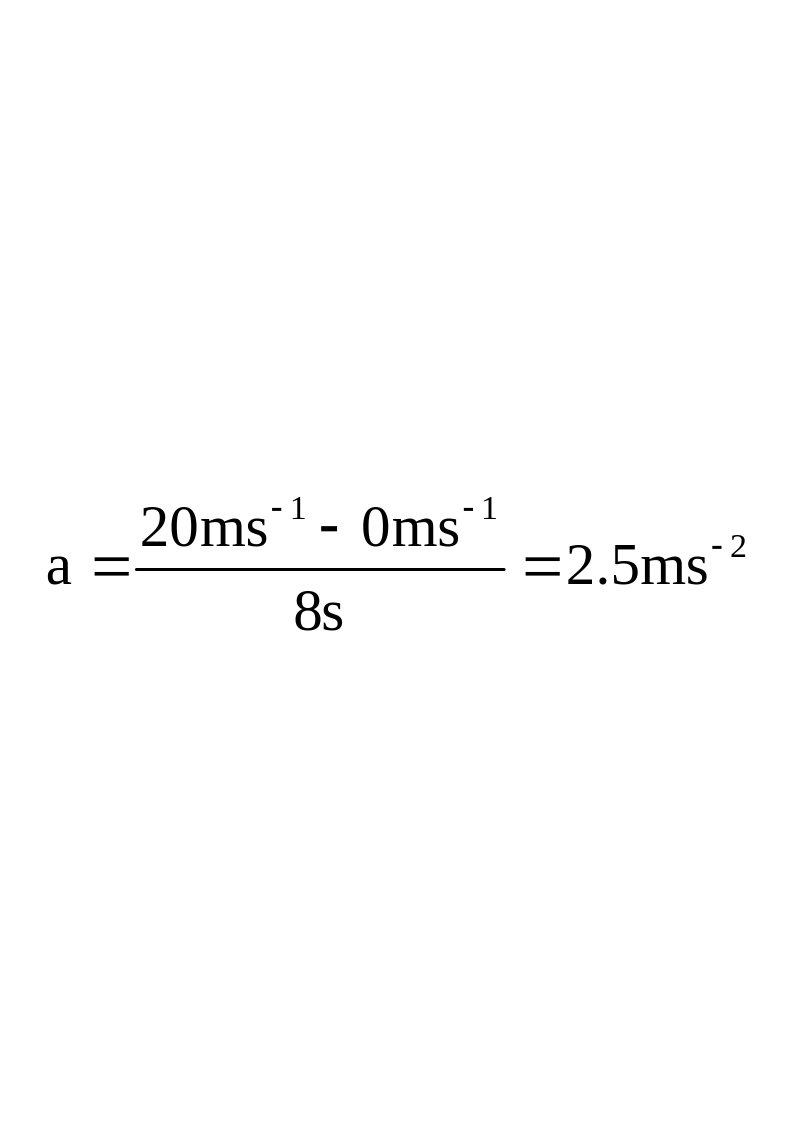
Q31. A car starts from rest. It velocity becomes 20ms–1 in 8 s. Find its acceleration.
Given Data:
Initial velocity = vi = 0
Final velocity = vf = 20 ms–1
Time = t = 8s
To Find:
Accleceration = a = ?
Calculations:
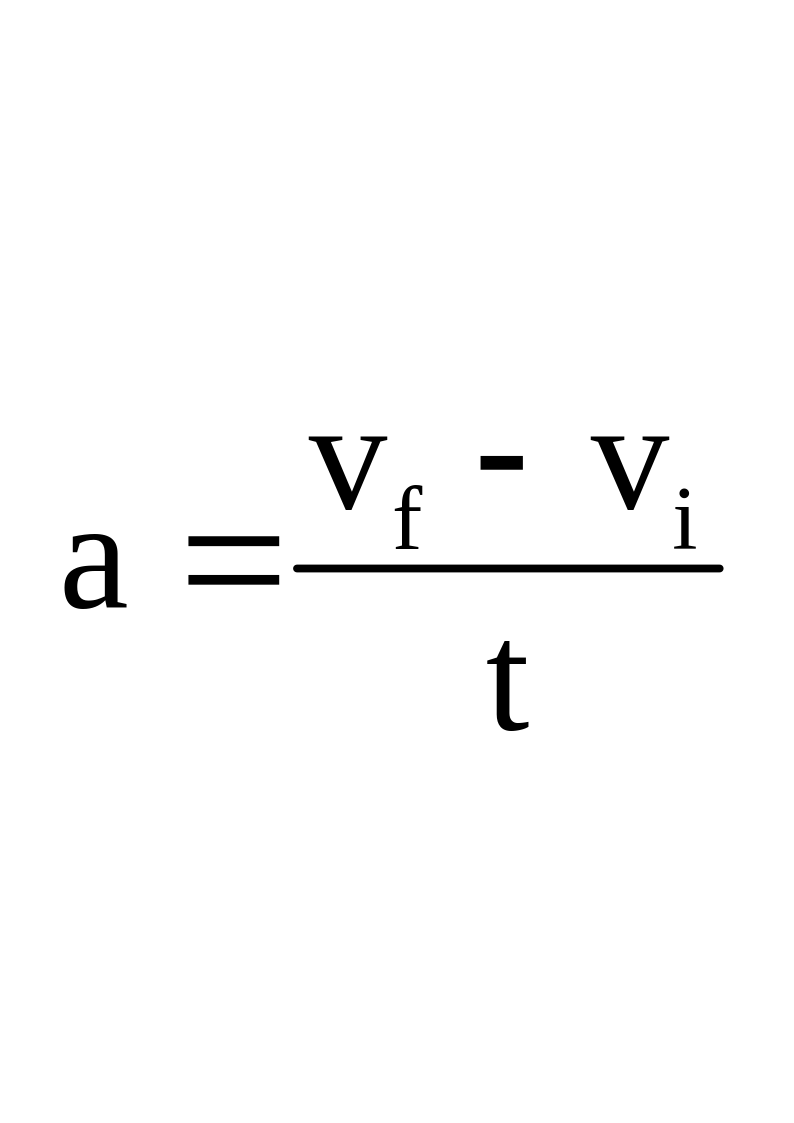
As
Or
Result:
Hence the acceleration of the car will be 2.5ms–2.
EXAMPLE 2.5
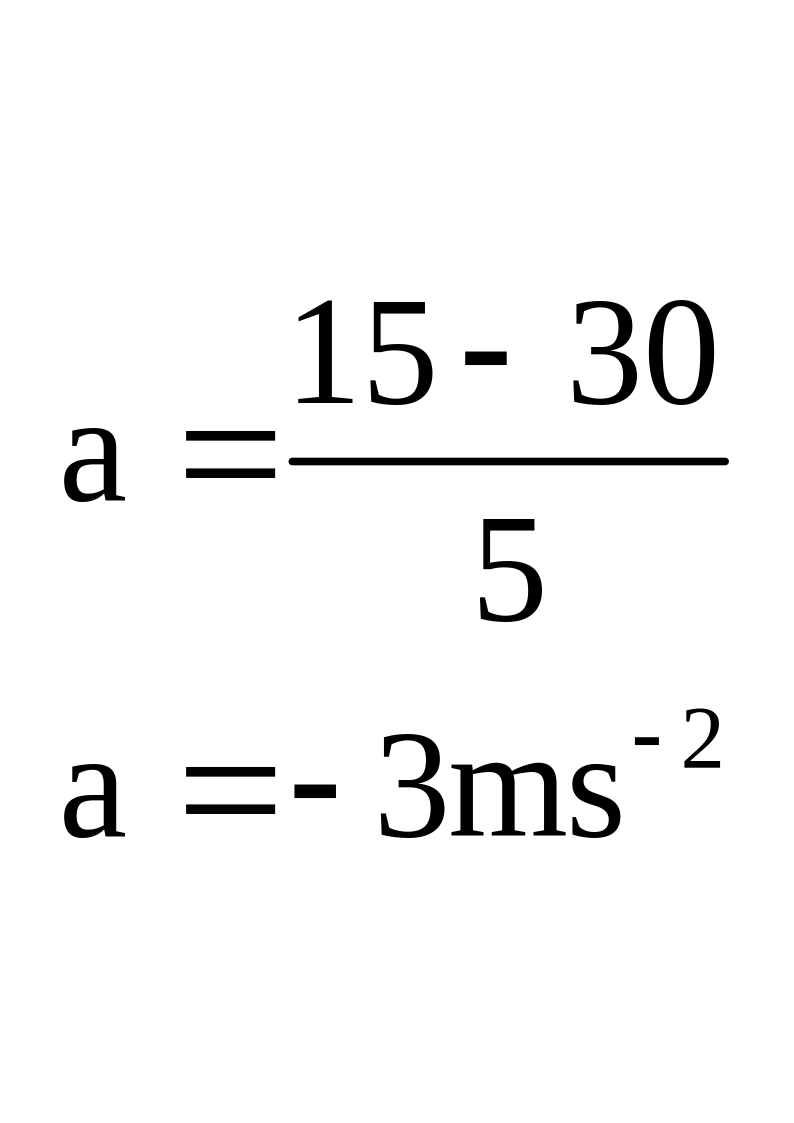
Q32. Find the retardation produced when a car moving at a velocity of 30 ms–1 slow down uniformly to 15 ms–1 in 5s.
Given data:
Initial velocity = vi = 30ms–1
Final velocity = vf = 15ms–1
Time = t = 3 s
To Find:
Retardation = –a = ?
Calculations:
We know
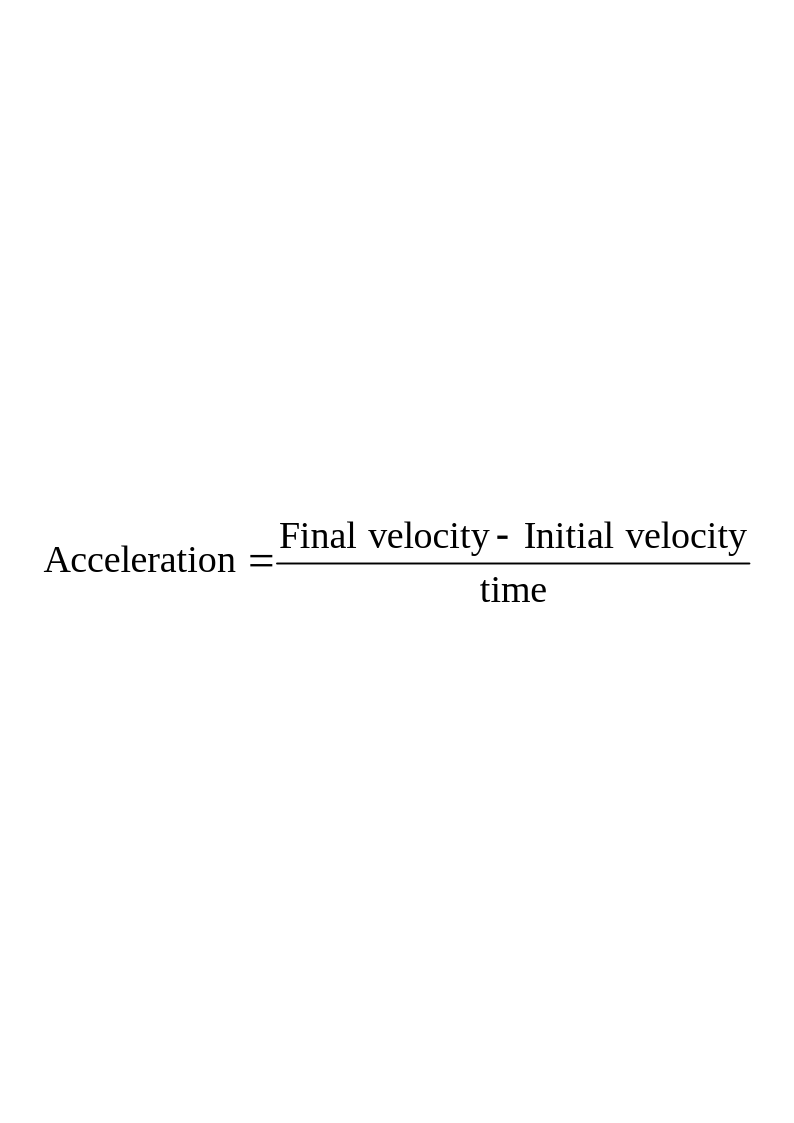
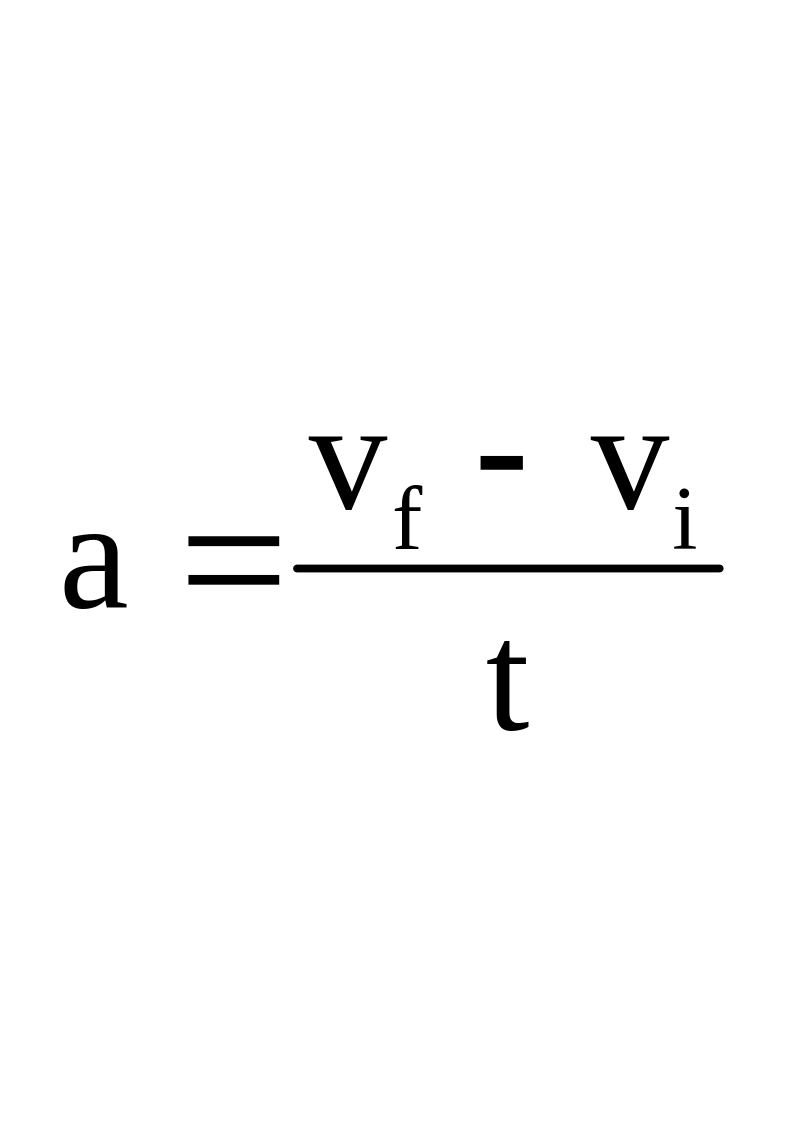
Acceleration =
So,
Result:
Hence, the retardation in the body will be 3ms–2.
2.4.1 Graphical Analysis Of Motion
Long Questions
Q1. What do you know about graph? Write their use?
GRAPH
Definition:
“Graph is a pictorial way of presenting the information about the relation between various Quantities”.
VARIABLES
Definition:
“The quantities between which a graph is plotted are called the variables.”
TYPES OF VARIABLES
Dependent Variables:
The quantities whose values depend on other quantities are called dependent variables. While plotting a graph dependent variable is taken along vertical axis.
Example:
While driving a car distance covered depends on time so distance is a dependent variable
Independent Variable:
The quantity whose value of does not depend on other quantities are called the independent variables. While plotting a graph independent variable is taken along horizontal axis.
Example:
Time is an independent variable.
Uses of Graphs:
Graphs can be used to:
Analyze motion of objects.
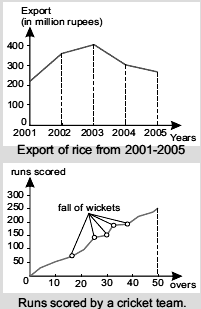
Show year–wise growth/decline of export, month–wise rainfall, a patient’s temperature record or runs per over scored by a team and so on.
Q2. Explain Distance – time Graph.
DISTANCE TIME GRAPH
It is useful to represent the motion of objects using graphs. The terms distance and displacement are used interchangeably when the motion is in a straight line. Similarly if the motion is in a straight line then speed and velocity are also used interchangeably. In a distance–time graph, time is taken along horizontal axis while vertical axis shows the distance covered by the object.
Explanation:
Distance time graphs for different bodies are given below:
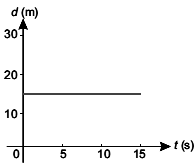
OBJECT AT REST
Definition:
“A body is said to be at rest, if it does not change its position with respect to its surroundings.”
In the case the distance moved by the object with time is zero. That is, the object is at rest. Thus, a horizontal line parallel to time axis on a distance–time graph shows that speed of the object is zero.
OBJECT MOVING WITH CONSTANT SPEED
Definition:
“A body has uniform or constant speed if it covers equal distances in equal intervals of time however short the interval may be.”
In this case distance time graph will be a straight line inclined to time Axis.
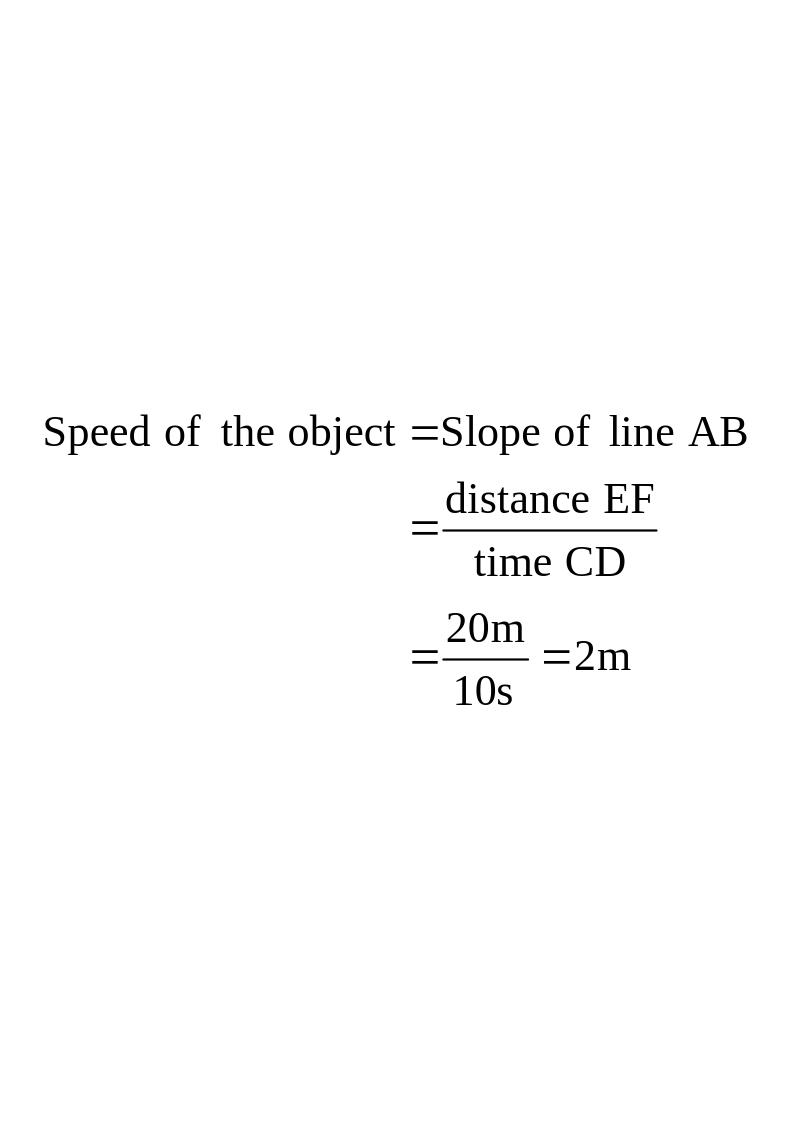
Consider two points A and B on the graph its slope gives the speed of the object as:
The speed found from the graph is 2ms–1.
OBJECT MOVING WITH VARIABLE SPEED
Definition:
“If a body does not cover equal distances in equal intervals of time, however short the intervals may be, then the speed of the body is said to be variable.”
In this case distance time graph will not be a straight line
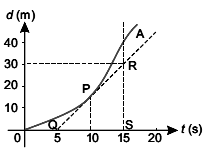
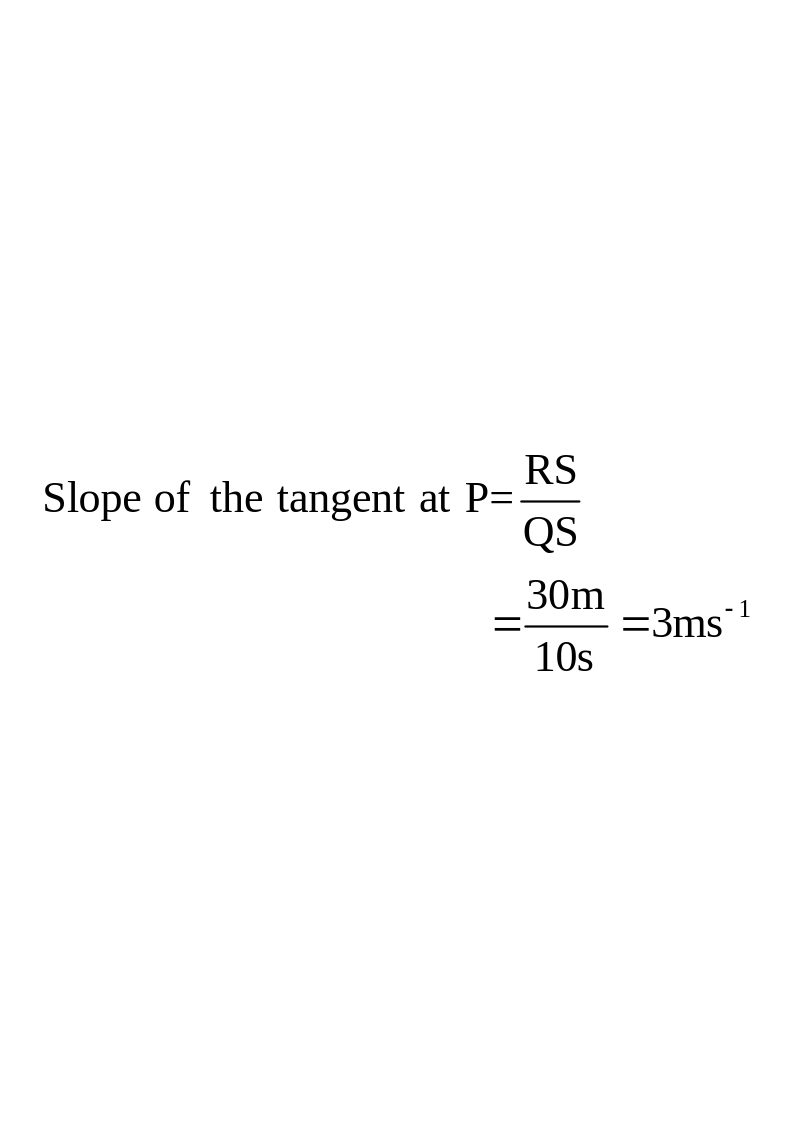
The slope of the curve at any point can be found from the slope of the tangent at that point. For example:
Thus speed of the object at point P is 3ms–1. The speed is higher at instants where slope is greater and speed is zero at instants where slope is horizontal.
Q3. Explain Speed – Time Graph.
SPEED TIME GRAPH
“The graph that shows the relationship between speed of an object and time taken by it, is called speed time graph.”
In a speed – time graph, time is taken along x – axis and speed is taken along y–axis.
Explanation:
Speed time graph different situations are given below:
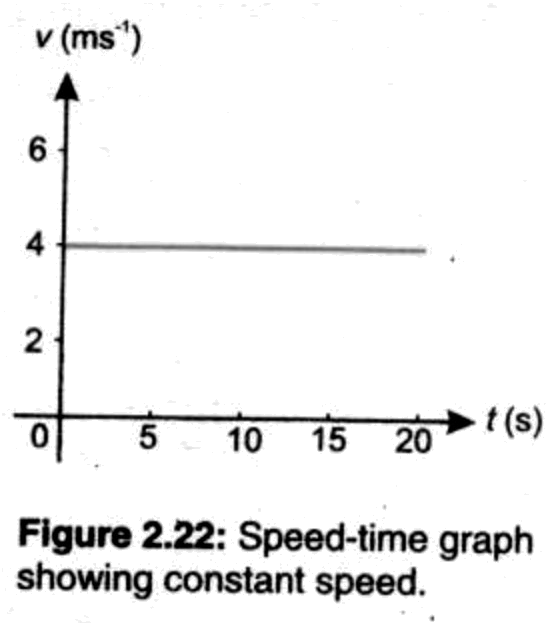
SPEED TIME GRAPH FOR CONSTANT SPEED
When speed of an object is constant with time, then the speed – time graph will be a horizontal line parallel to time – axis as shown in figure. In other words, a straight line parallel to time axis represents constant speed of the object.
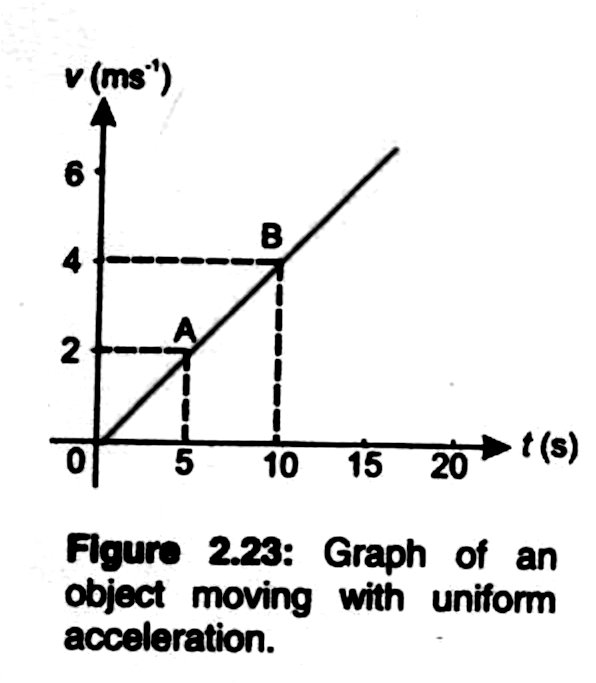
SPEED TIME GRAPH FOR UNIFORM ACCELERATION
Definition:
“A body has uniform acceleration if it has equal changes in velocity in equal intervals of time however short the interval maybe.”
Let the speed of an object be changing uniformly. In such a case speed is changing at constant rate.
Thus its speed–time graph would be a straight line such as shown in figure below:
A straight line means that the object is moving with uniform acceleration. Slope of the line gives the magnitude of its acceleration.
DISTANCE TRAVELLED BY A MOVING OBJECT
The area under a speed – time graph represents the distance travelled by the object. If the motion is uniform then the area can be calculated using appropriate formula for geometrical shapes represented by the graph.
Short Questions
Q1. How can we find distance from speed time graph?
TO FIND DISTANCE
We can find distance from speed time graph by finding total are under the graph because in speed time graph total area under the graph shows total distance covered by the body.
EXAMPLE 2.6
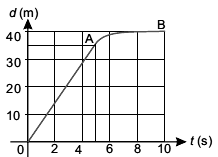
Below figure shows the distance–time graph of a moving car.
From the graph, find
(a) The distance car has travelled.
(b) The speed during the first five seconds.
(c) Average speed of the car.
Q2. (d) Speed during the last 5 seconds. (Example 2.6)
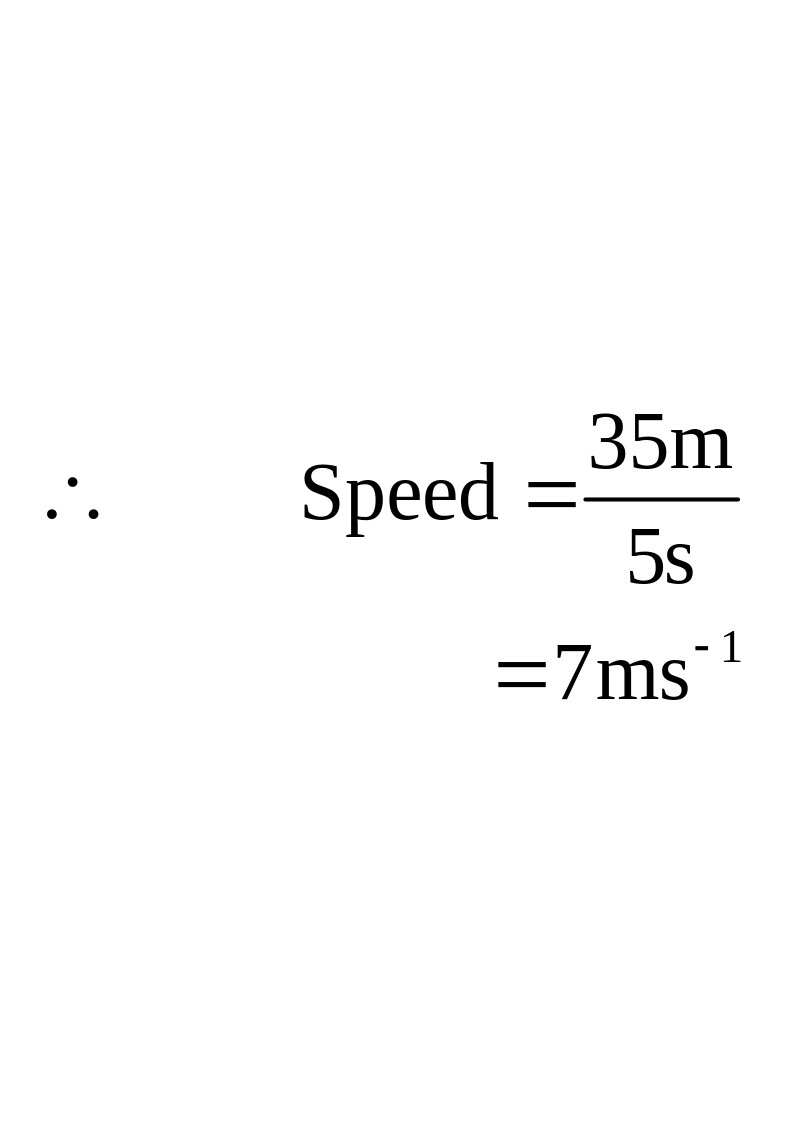
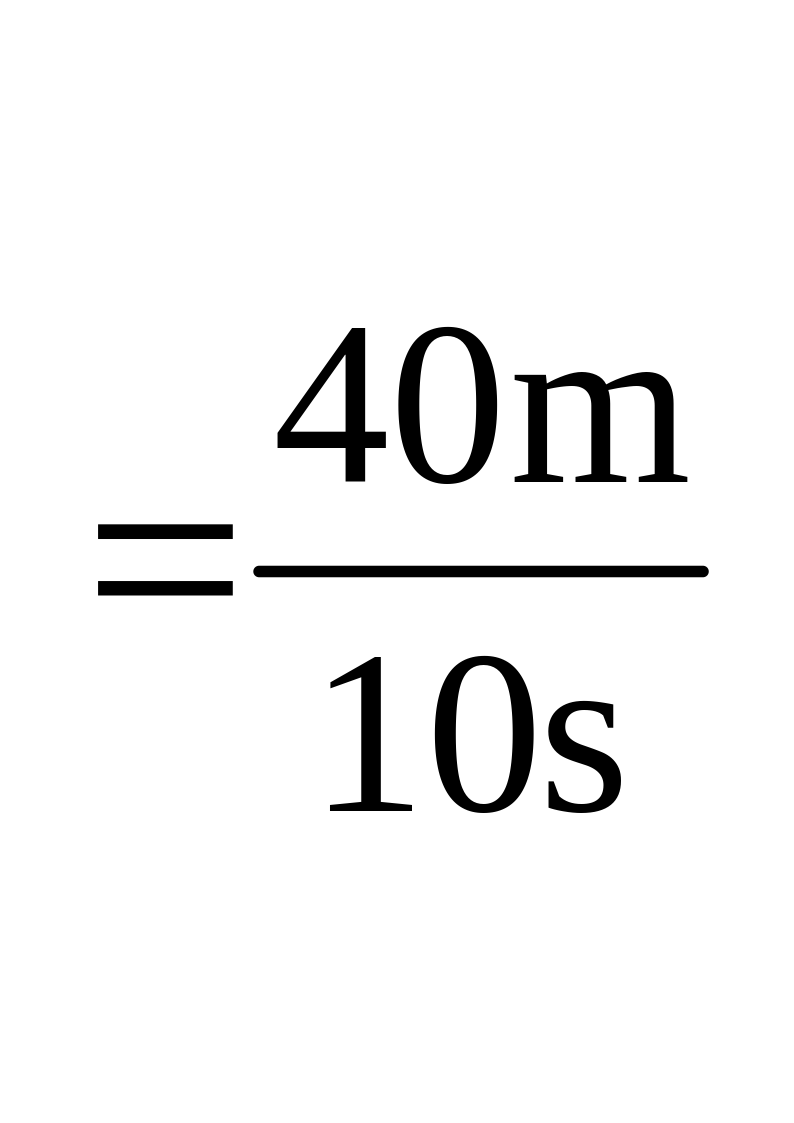
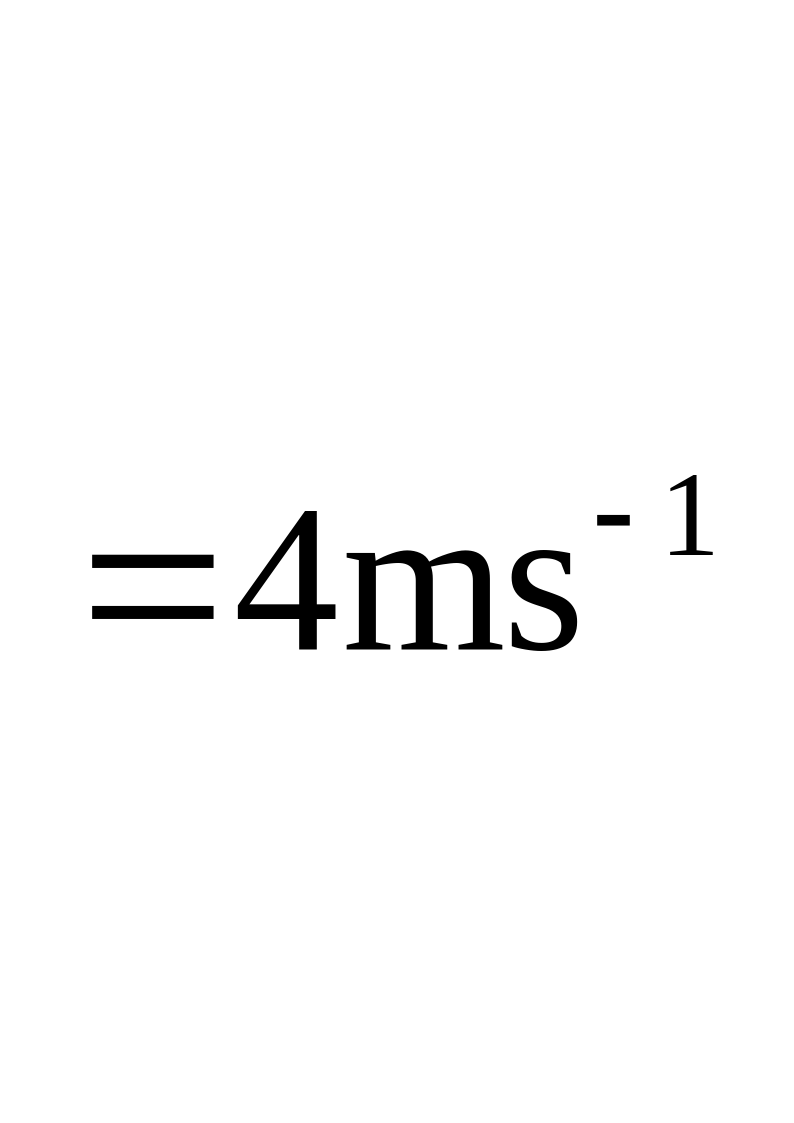
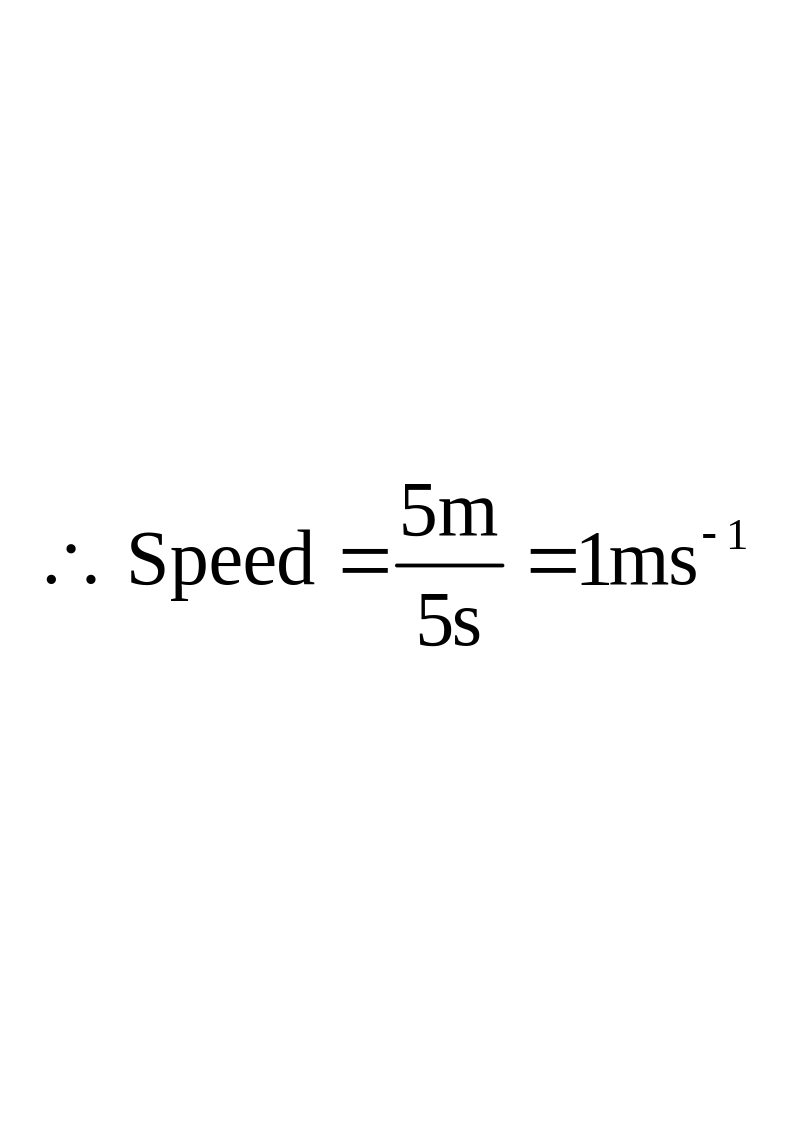
(a) Total distance travelled = 40 m
(b) Distance travelled during first 5s is 35 m
(c) Average speed
(d) Distance moved during the last 5 s = 5 m
Result:
EXAMPLE 2.7
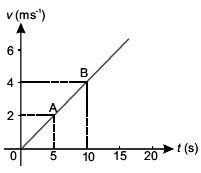
Q3. Find the acceleration from speed–time graph shown in figure given below:
On the graph in above figure, point A gives speed of the object as 2 ms–1 after 5 s and point B gives speed of the object as 4 ms–1 after 10 s.
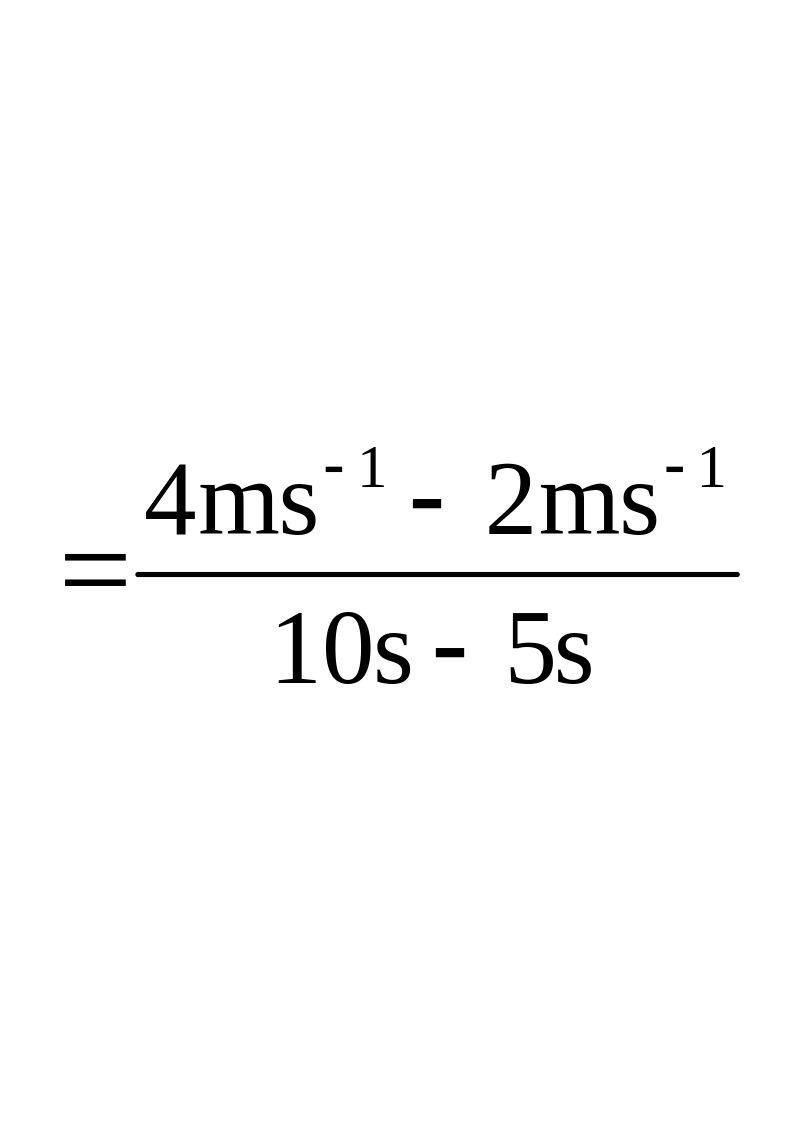
As Acceleration = slope of AB
Where slope = change in velocity / time interval
acceleration
Result:
In above speed time graph acceleration of the body is 4ms–2.
EXAMPLE 2.8
Q4. Find the acceleration from speed–time graph shown in figure below:
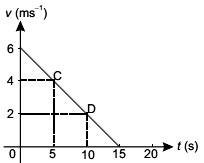
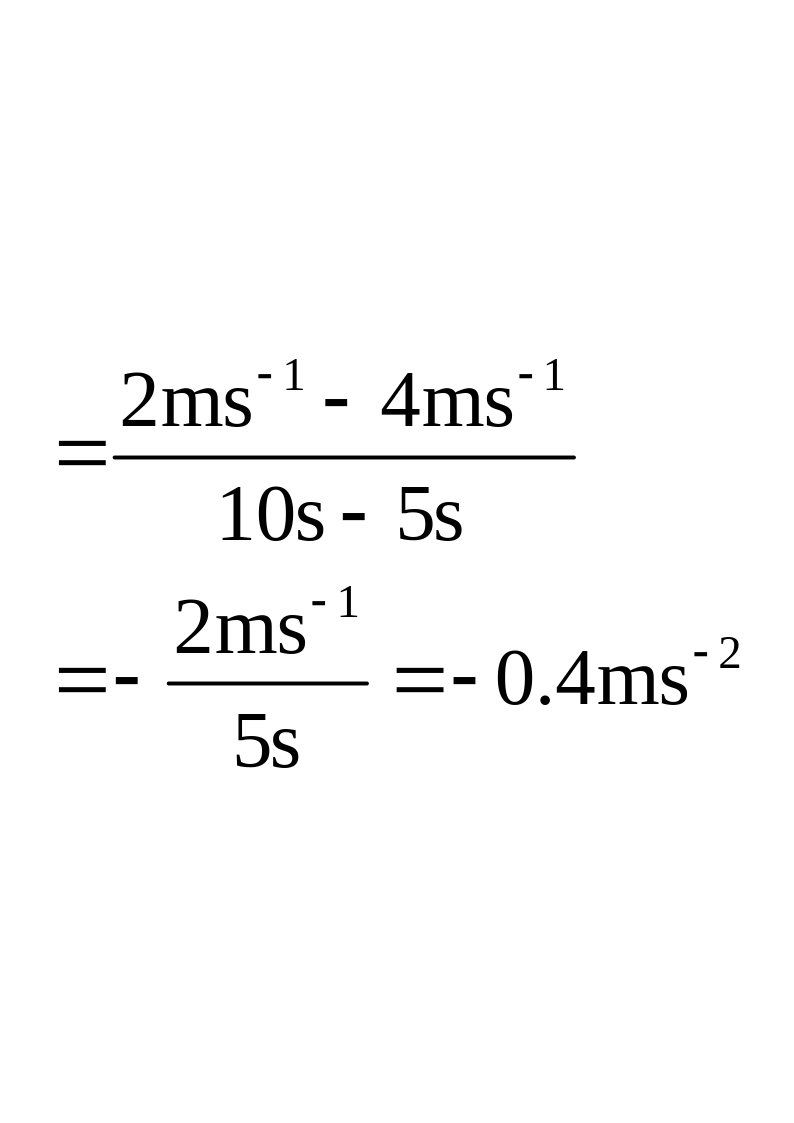
In above figure the graph shows that the speed of the object is decreasing with time. The speed after 5s is 4 ms–1 and it becomes 2ms–1after 10 s.
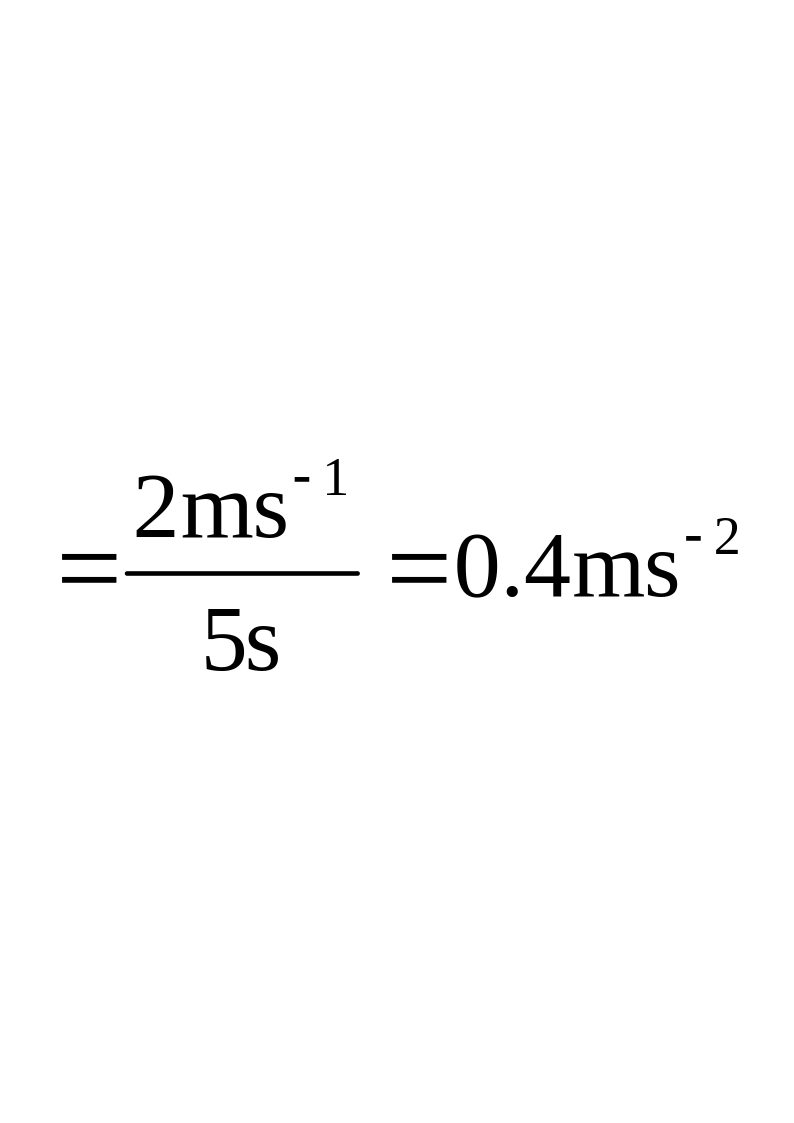
As acceleration = slope of CD
Result:
Above graph shows that the deceleration of the body is 0.4ms–2.
EXAMPLE 2.9
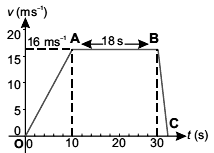
A car moves in a straight line. The speed–time graph of its motion is shown in figure below:
From the graph, Find:
(a) Its acceleration during the first 10 seconds.
(b) Its deceleration during the last 2 seconds.
(c) Total distance travelled.
Q5. (d) Average speed of the car during its journey.
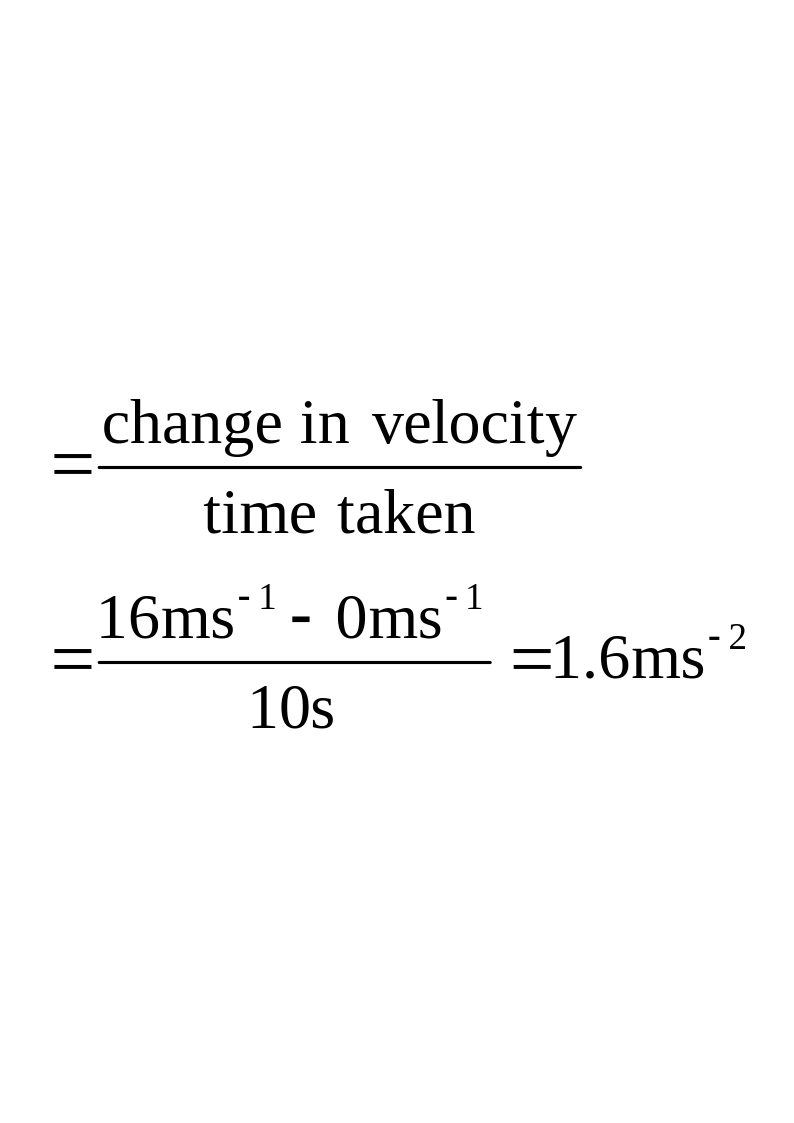
(a) Acceleration during the first 10 seconds,
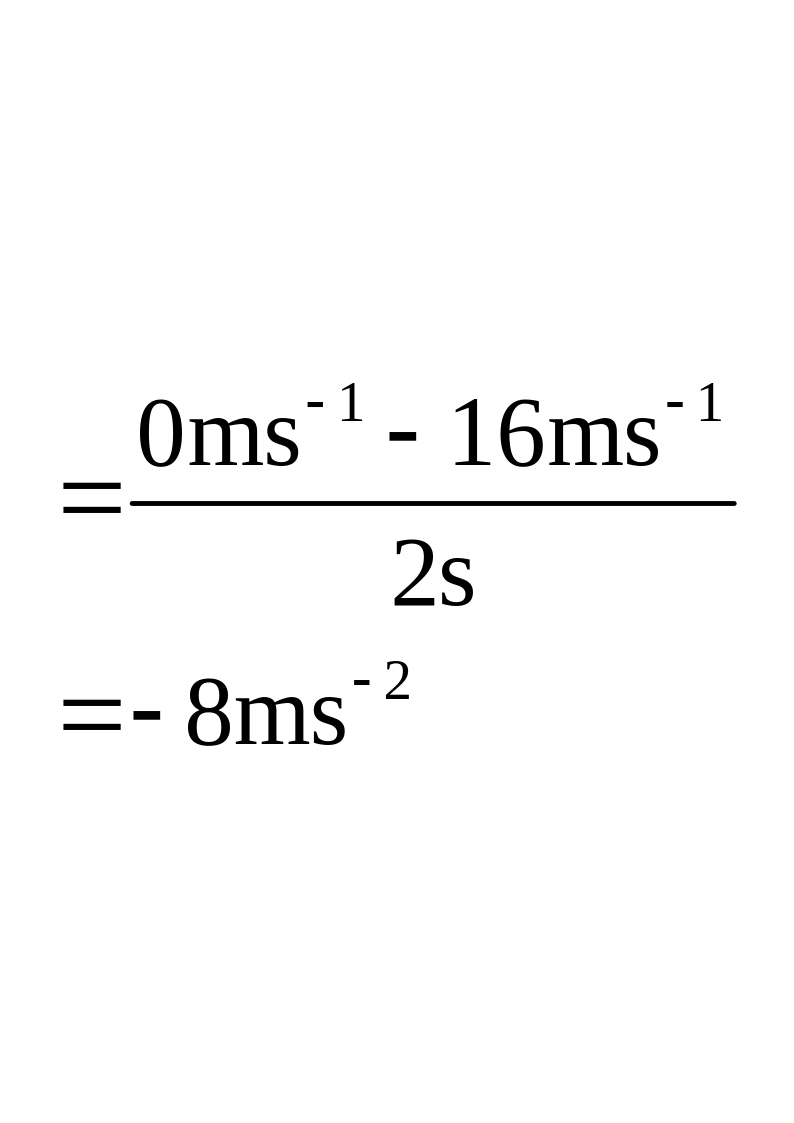
(b) Acceleration during the last 2 seconds,
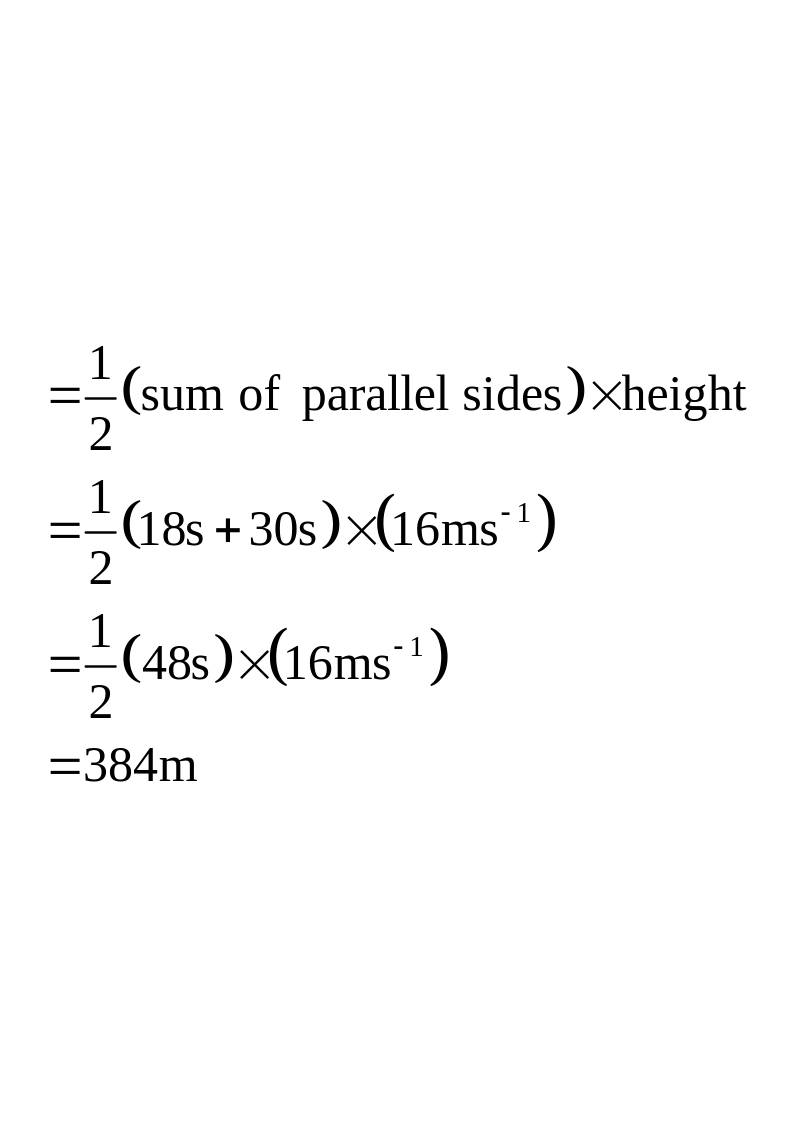
(c) Total distance travelled = area under the graph (trapezium OABC)
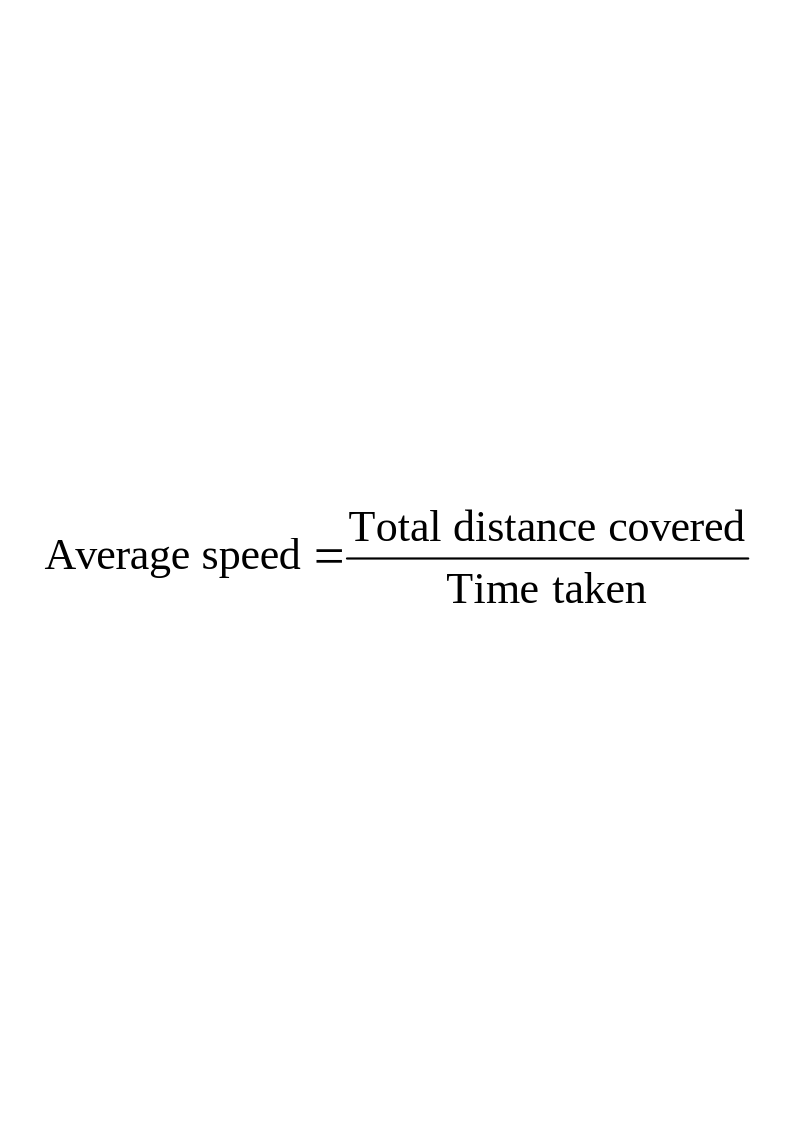
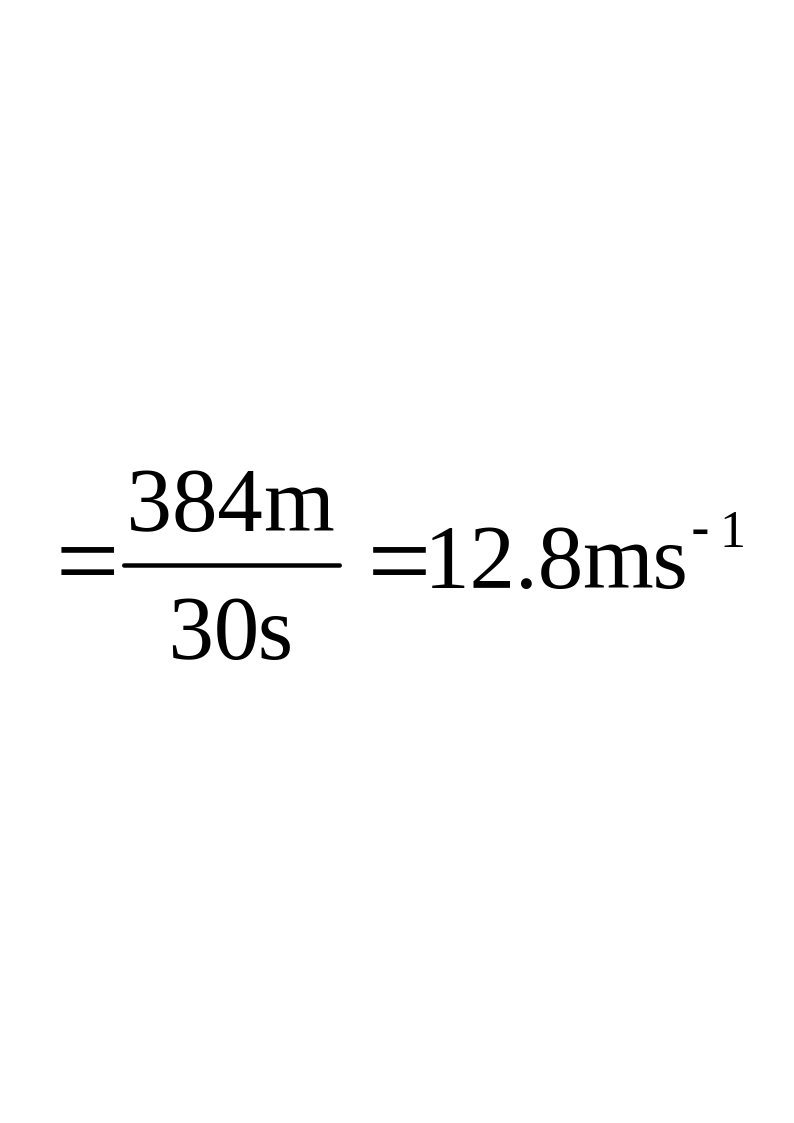
(d)
Result:
2.6 Equations Of Motion
Long Questions
Q1. Derive first equation of motion using speed time graph. OR Prove that vf = vi + at (GRW 2013)
FISRT EQUATION OF MOTION
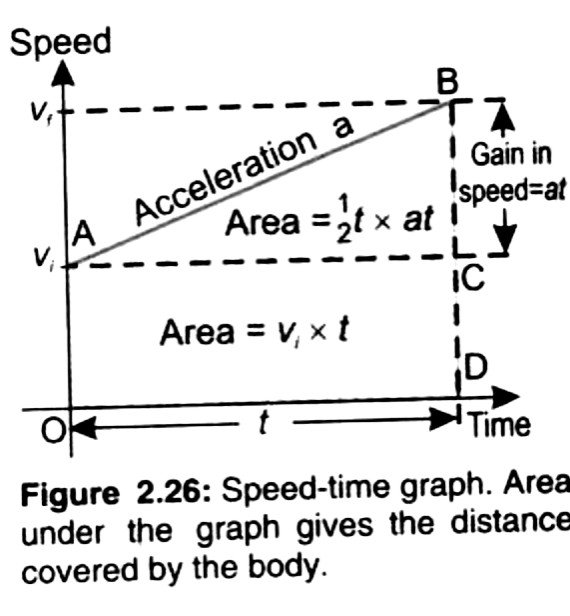
Consider a body is moving with initial velocity “vi” in a straight line with uniform acceleration “a”. Its velocity becomes “vf” after time “t”. The motion of the body is described by speed – time graph as shown in figure.
In this case:
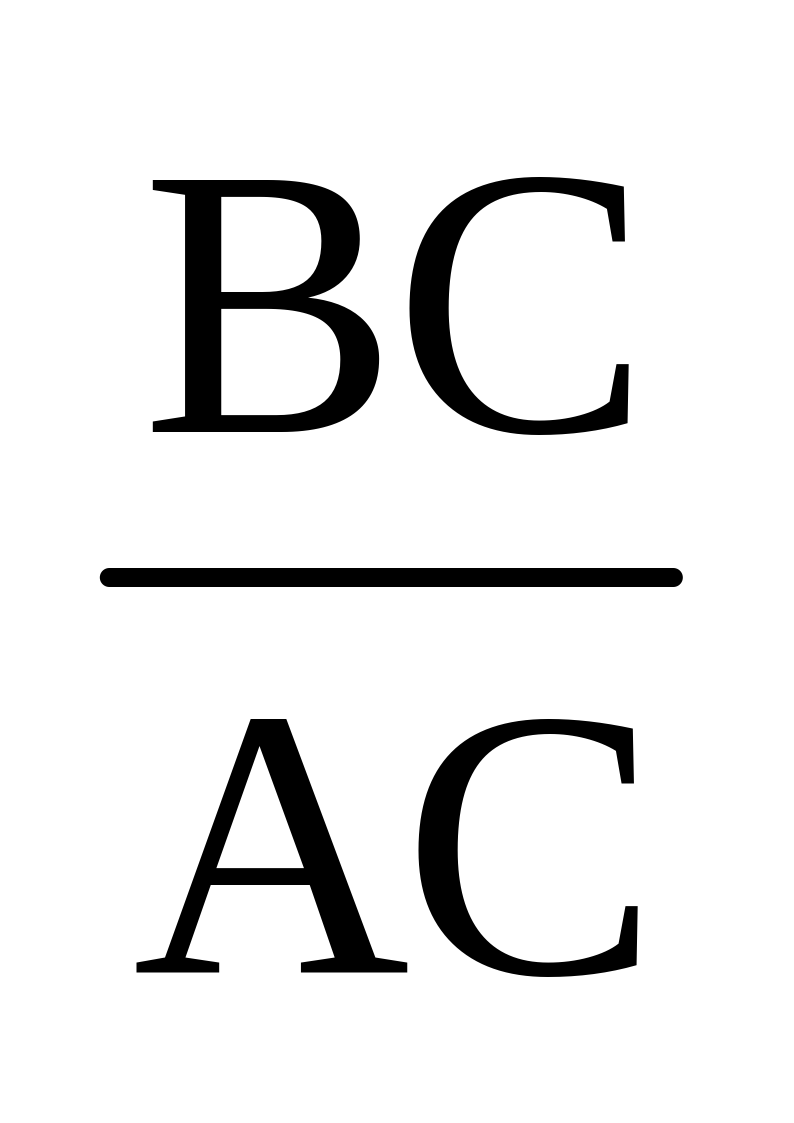
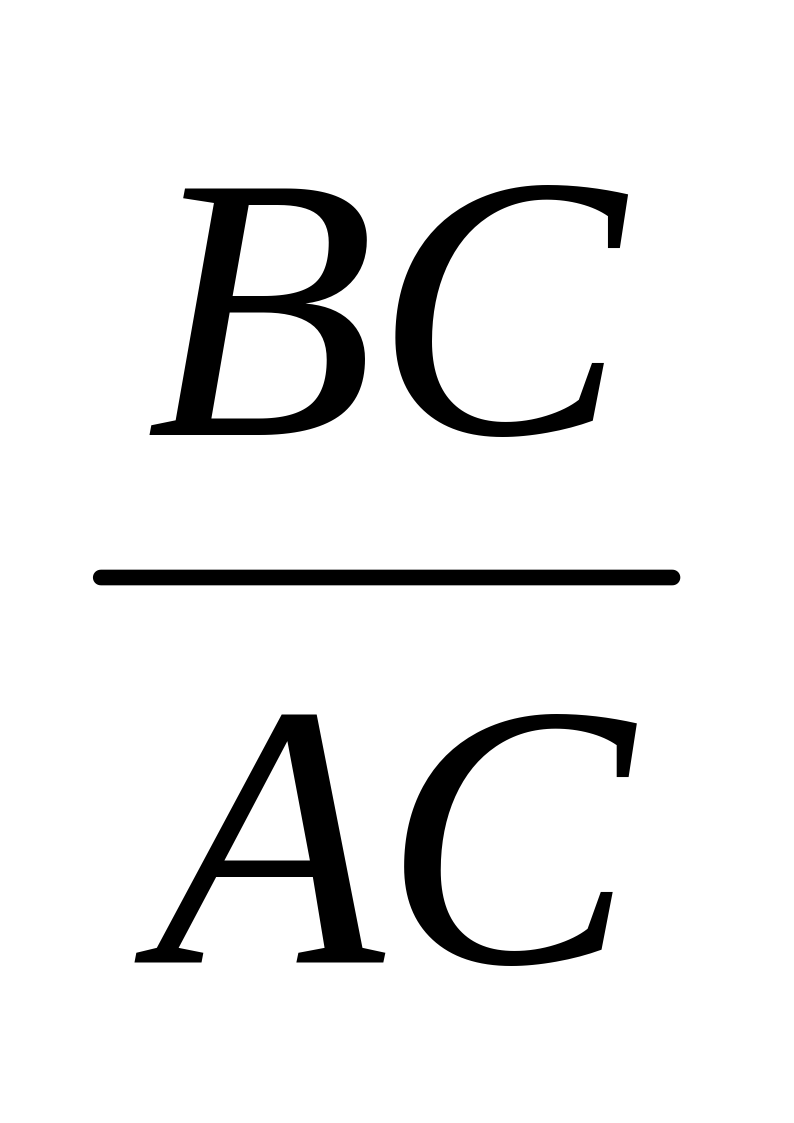
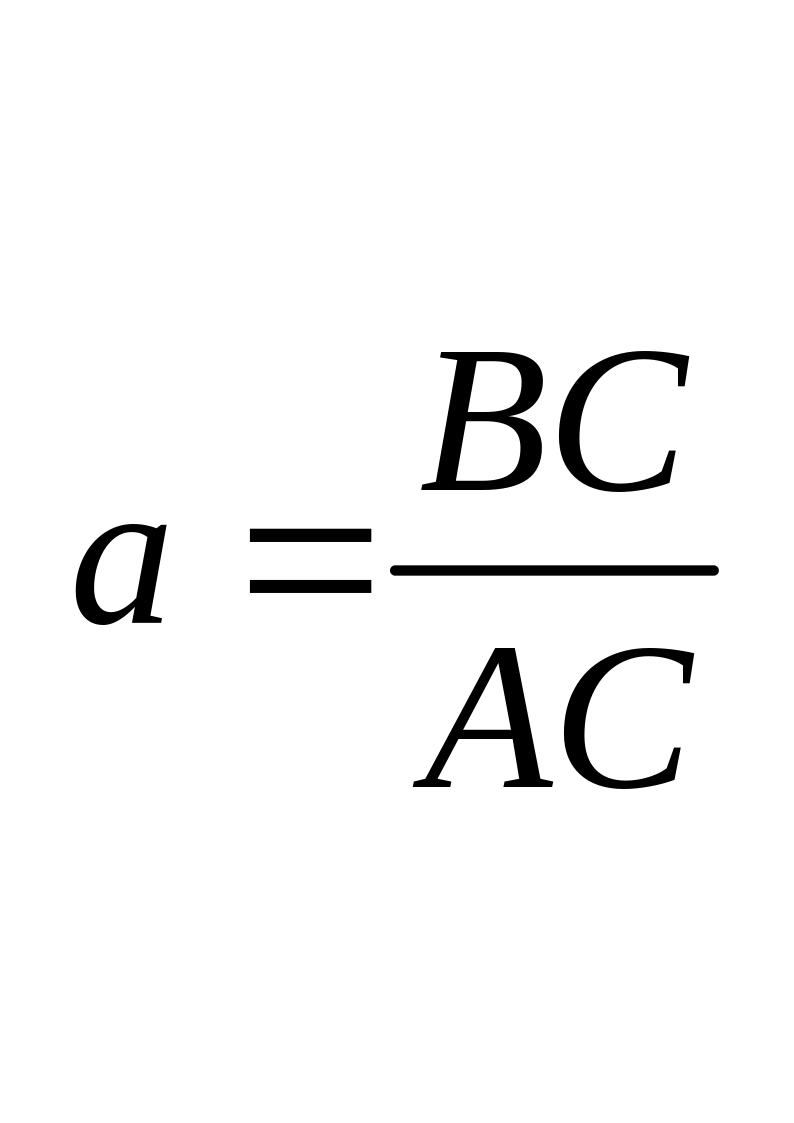
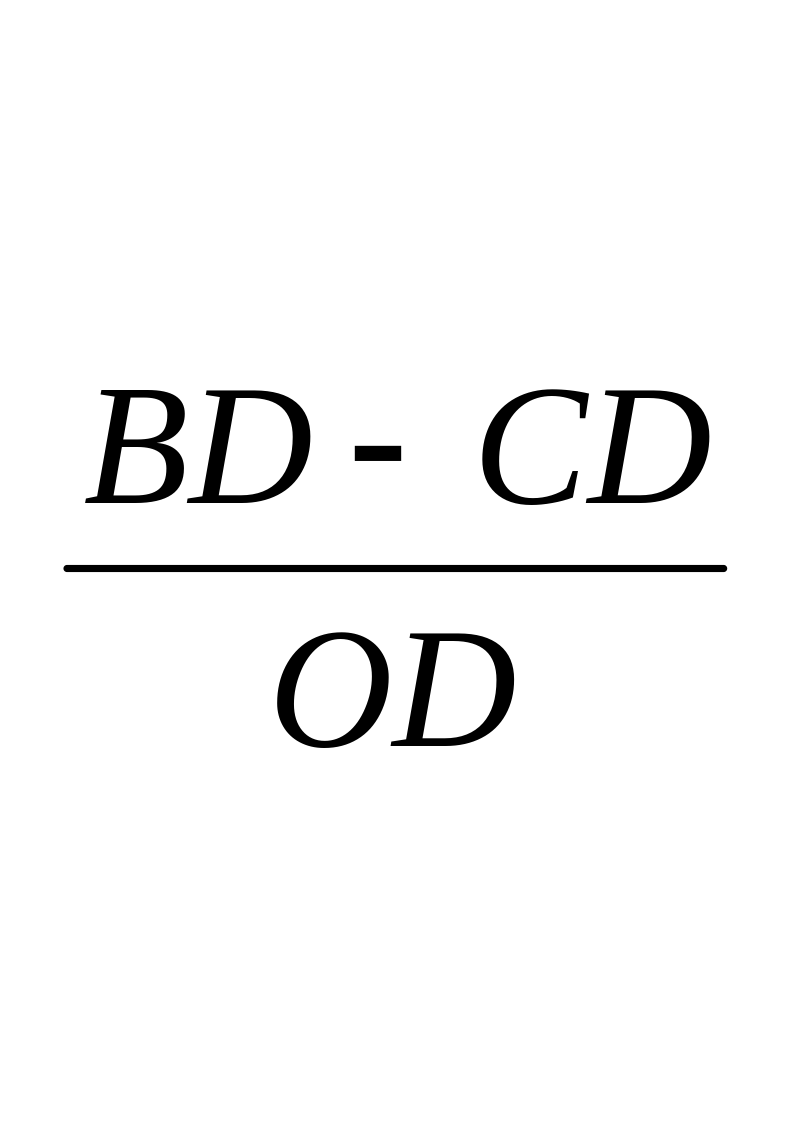
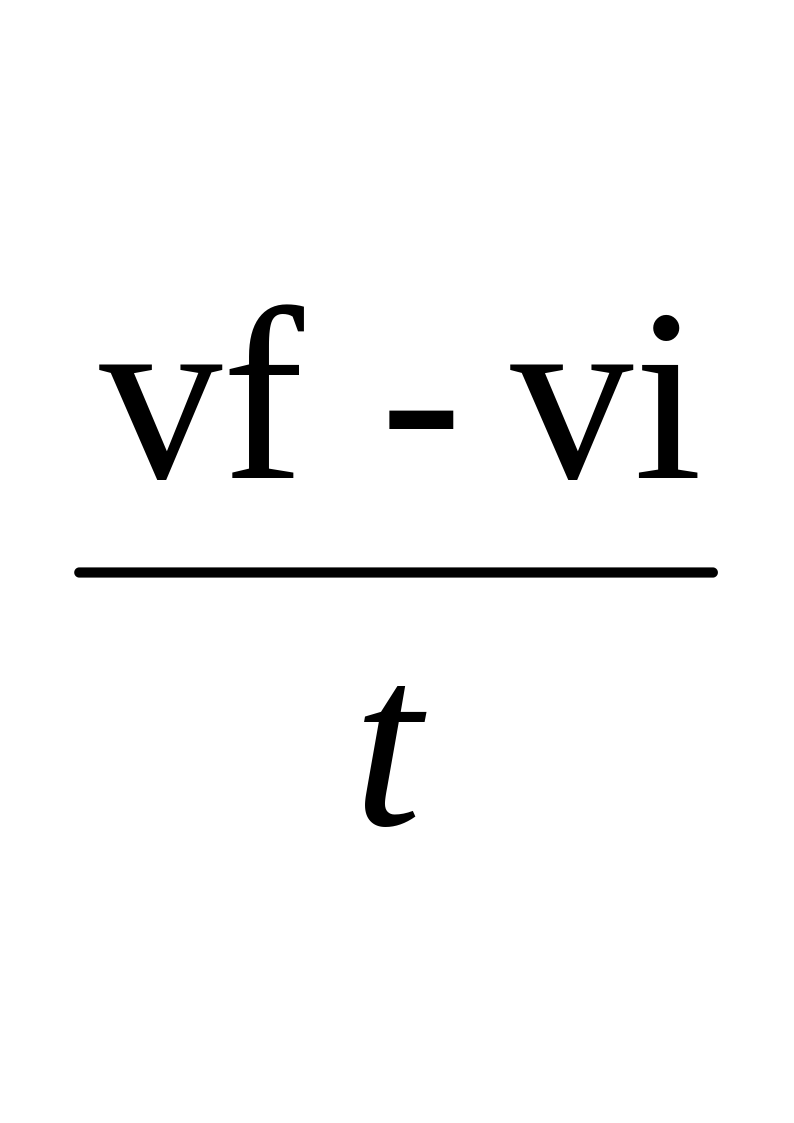
Slope of line AB =
We know that slope of line in speed–time graph gives the magnitude of acceleration.
Acceleration =
As AC = OD and BC = BD – CD
So, a =
As BD = vf
CD = vi
OD = t
Hence a =
Or at = vf – vi
Therefore, vf = vi + at
This is called first equation of motion.
Conclusion:
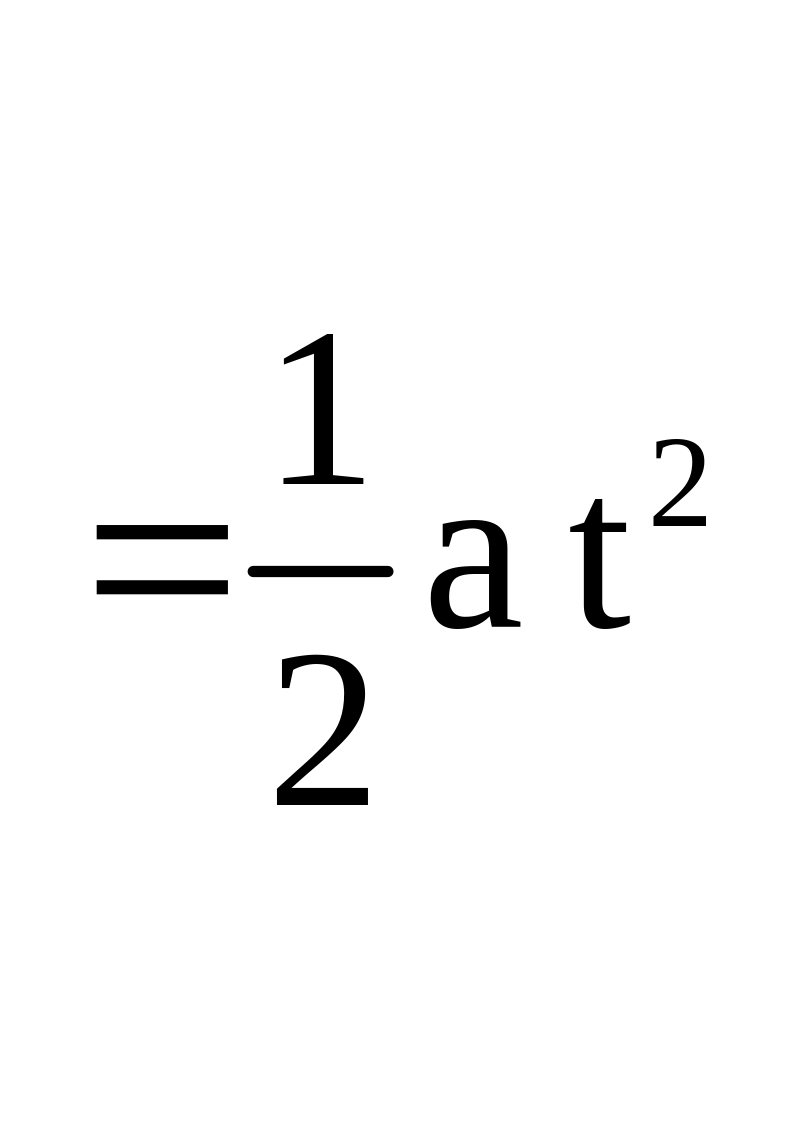
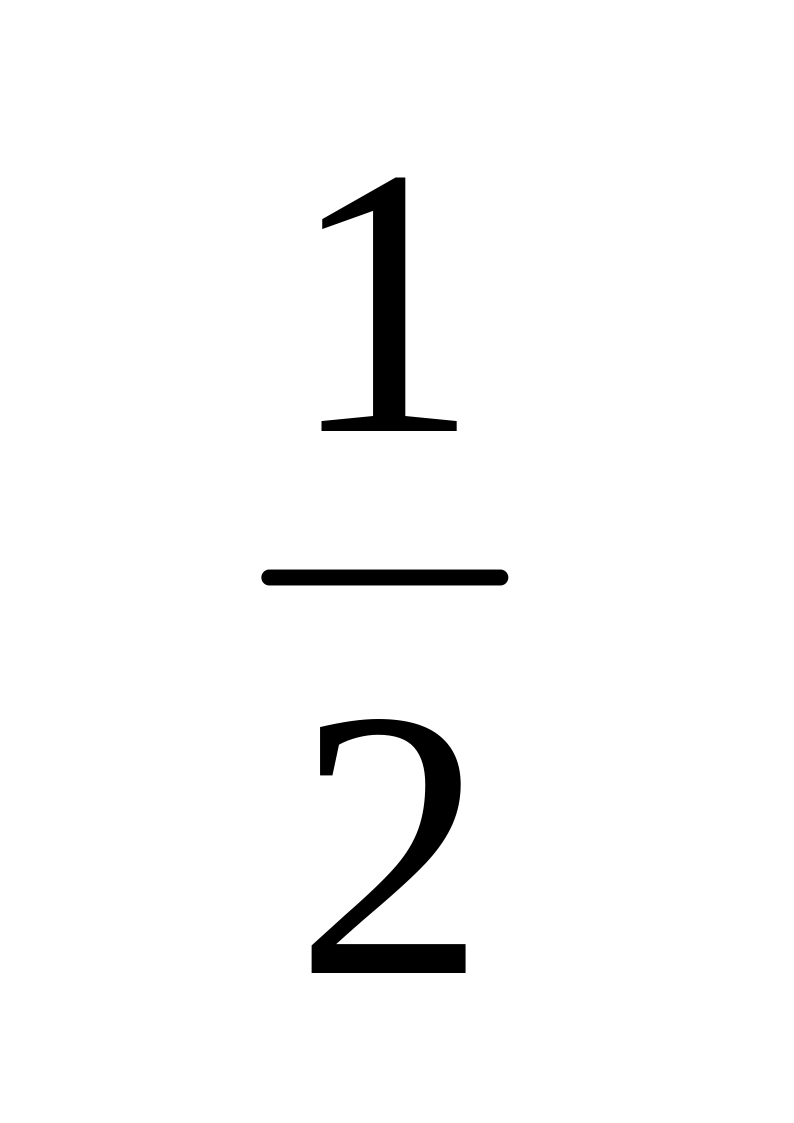
Q2. Derive second equation of motion using speed–time graph. (LHR 2012, 2013) OR Prove that S = vit + ½ at2
SECOND EQUATION OF MOTION
Consider a body is moving with initial velocity “vi” in a straight line with uniform acceleration “a”. Its velocity becomes “vf” after time “t”. The motion of the body is described by speed – time graph as shown in figure:
In this case:
The total distance “S” travelled by the body is equal to the total area of the under the speed time graph. i.e.
Total Distance Covered = Area of the rectangle OACD + Area of the triangle ABC
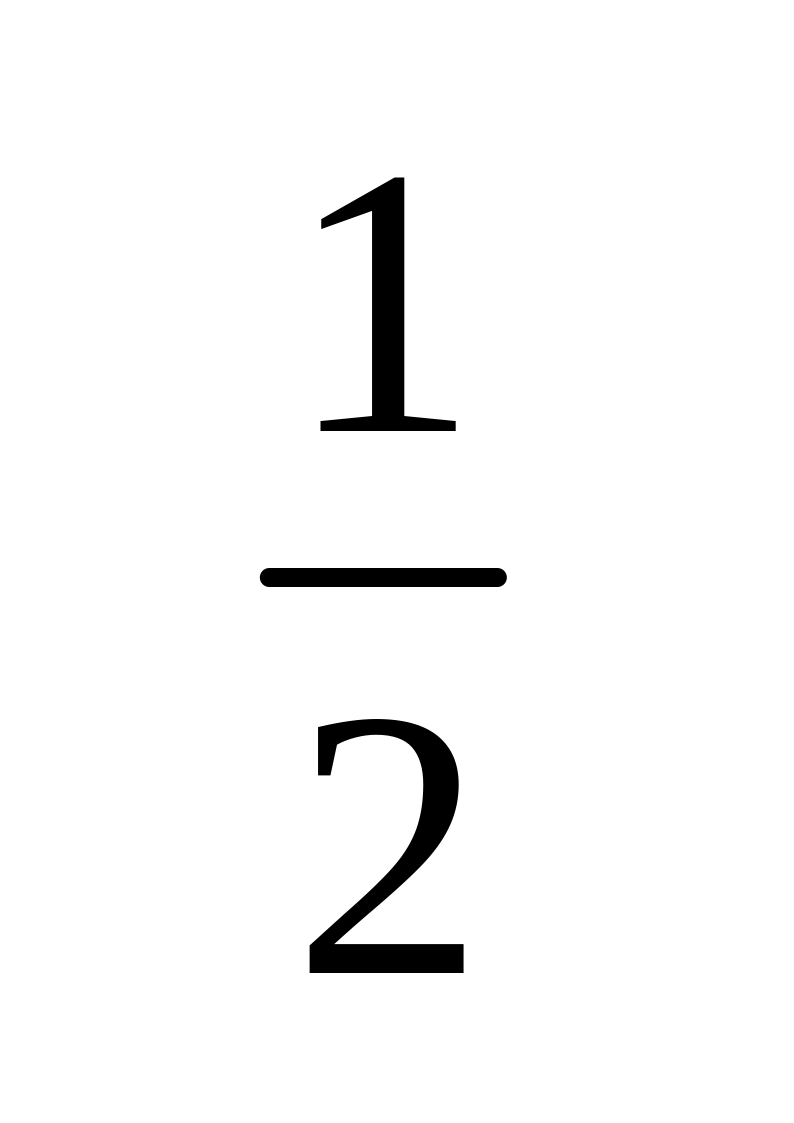
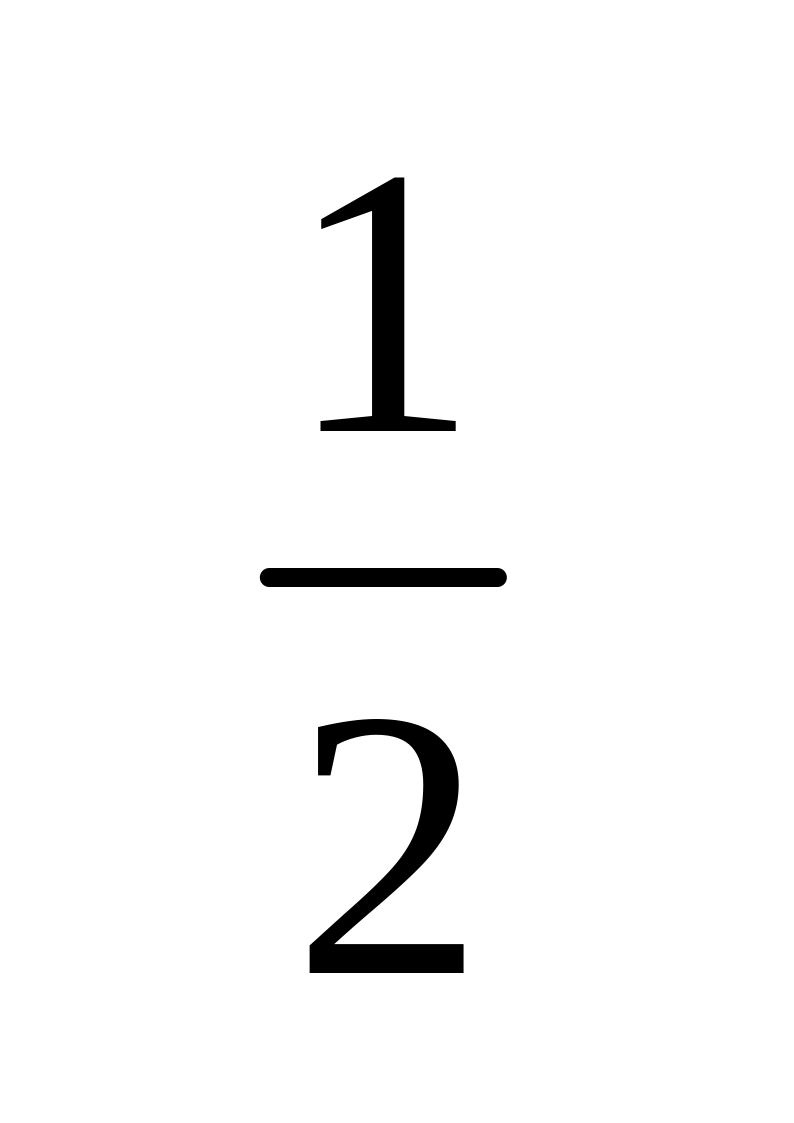
Area of the rectangle OACD = (width x length)
= OA x OD
= vi x t …………. (i)
Area of the triangle ABC = (width x length)
= (BC x AC)
= (BC x OD)
= at x t
–––––––––––––(ii)
Adding (i) and (ii)
S = vit + at2
This is called Second equation of motion.
Conclusion:
Q3. Derive third equation of motion using speed–time graph. (GRW 2015) OR Prove that 2aS = vf2 – vi2
THIRD EQUATION OF MOTION
Consider a body is moving with initial velocity “vi” in a straight line with uniform acceleration “a”. Its velocity becomes “vf” after time “t”. The motion of the body is described by speed – time graph as shown in figure.
In this case:
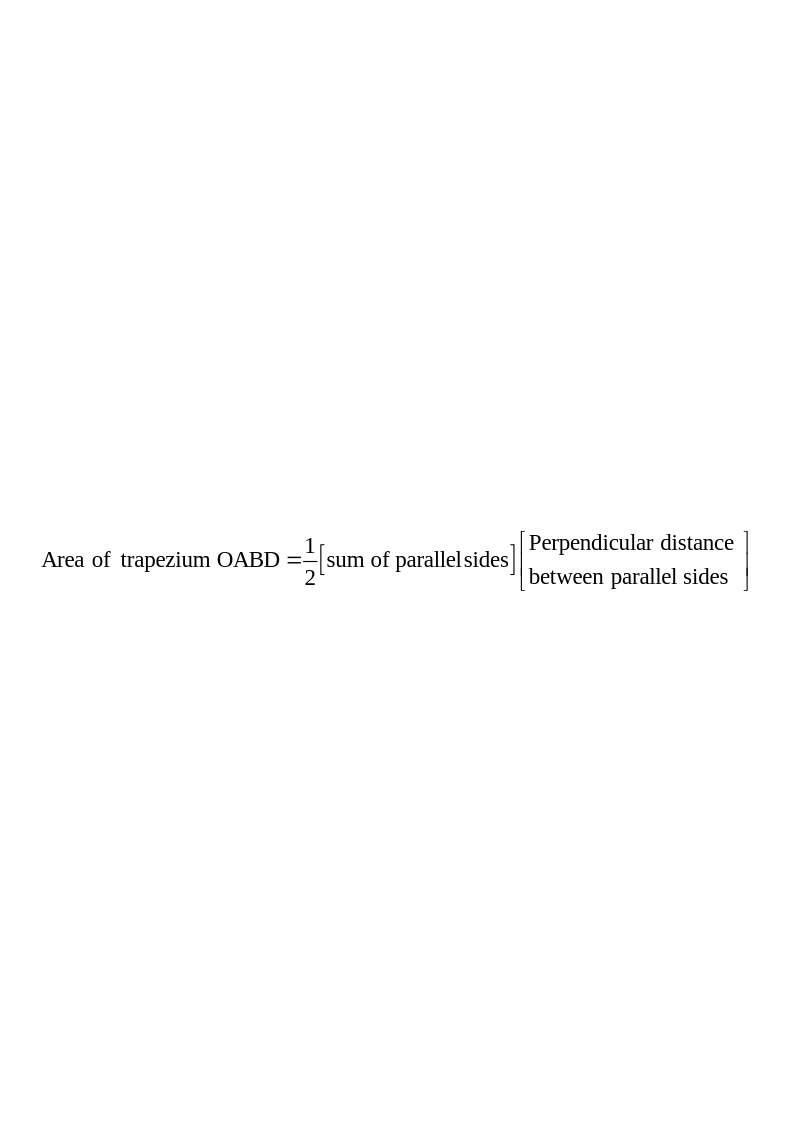
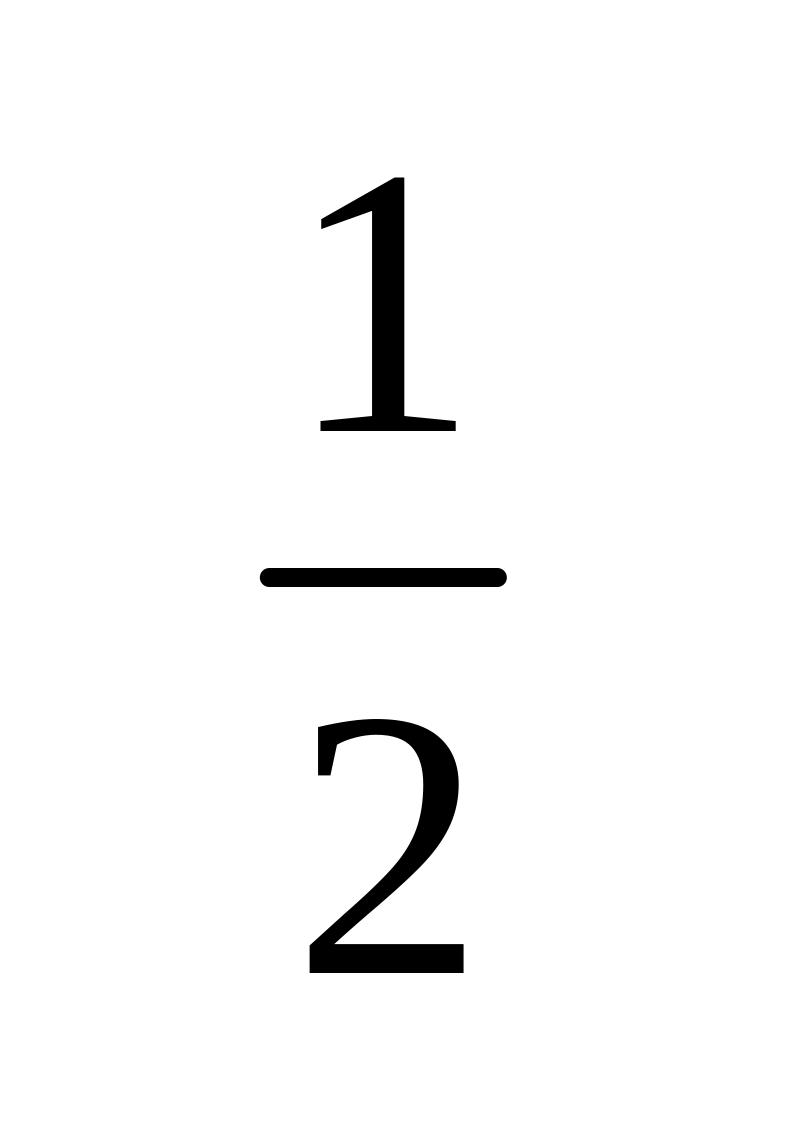
The total distance “S” travelled by the body is equal to the total area of trapezium OABD under the graph.
S =(BD + OA ) (OD)
Or 2S = (BD + OA ) (OD)
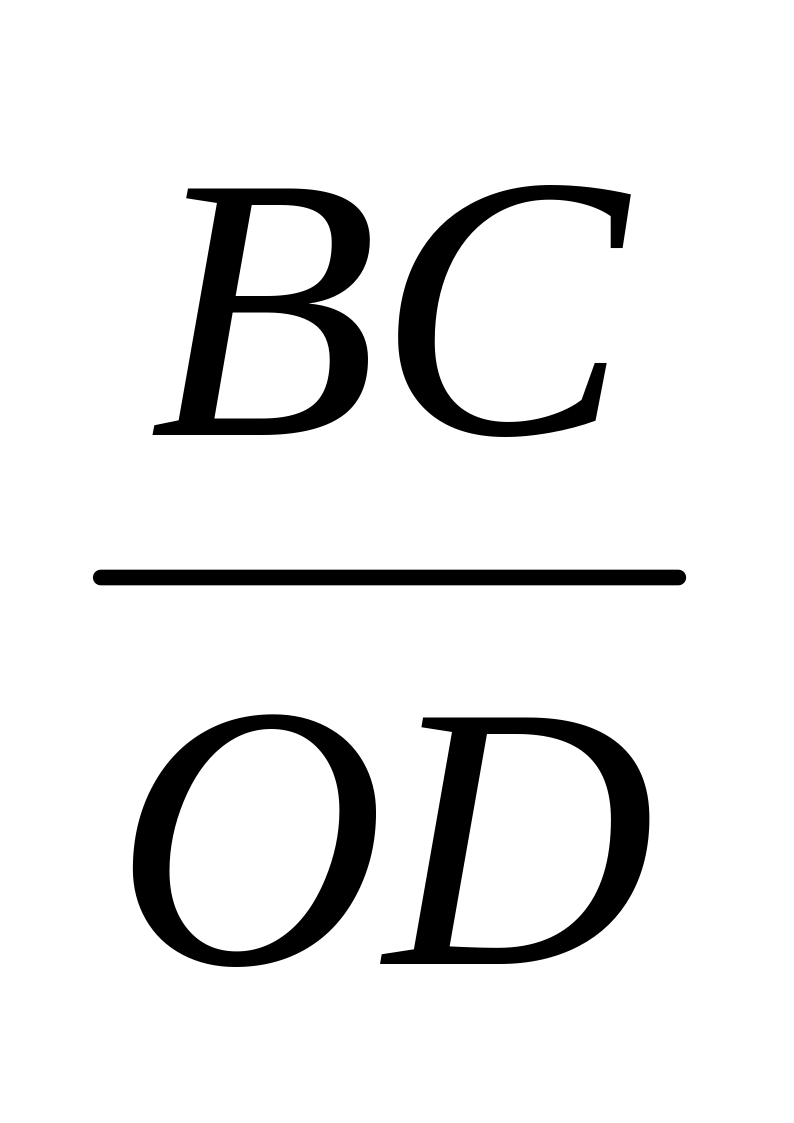
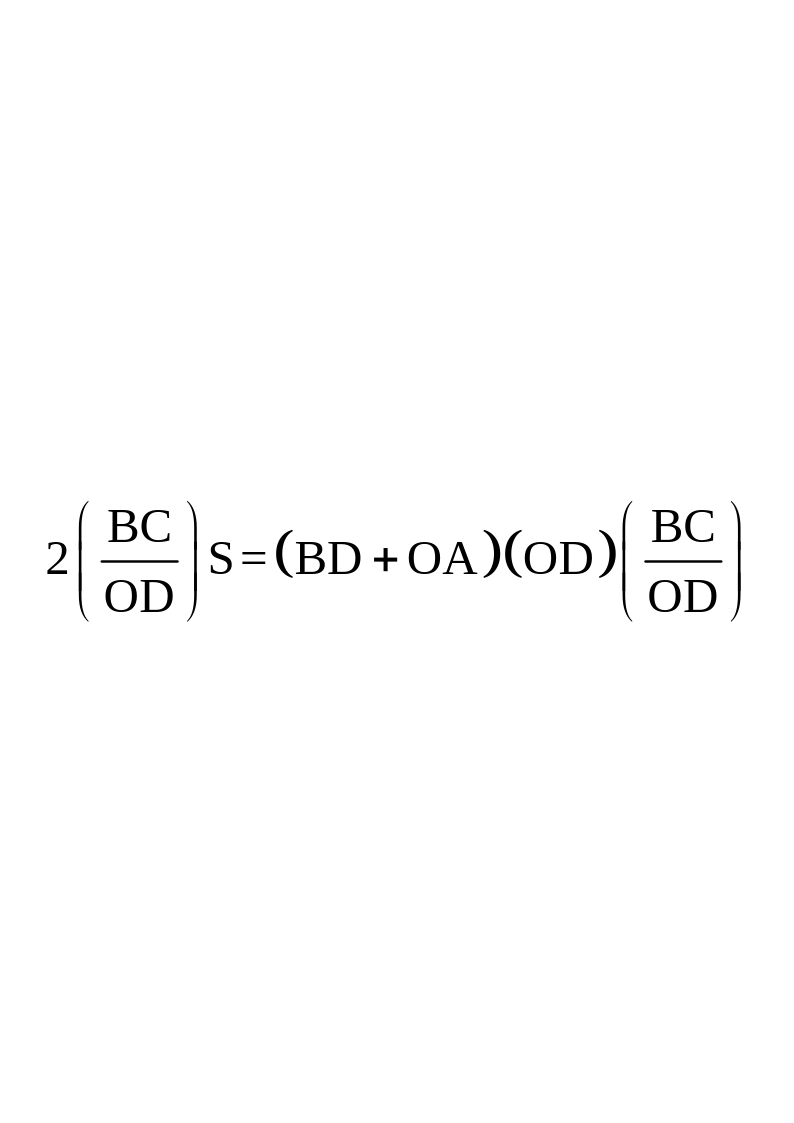
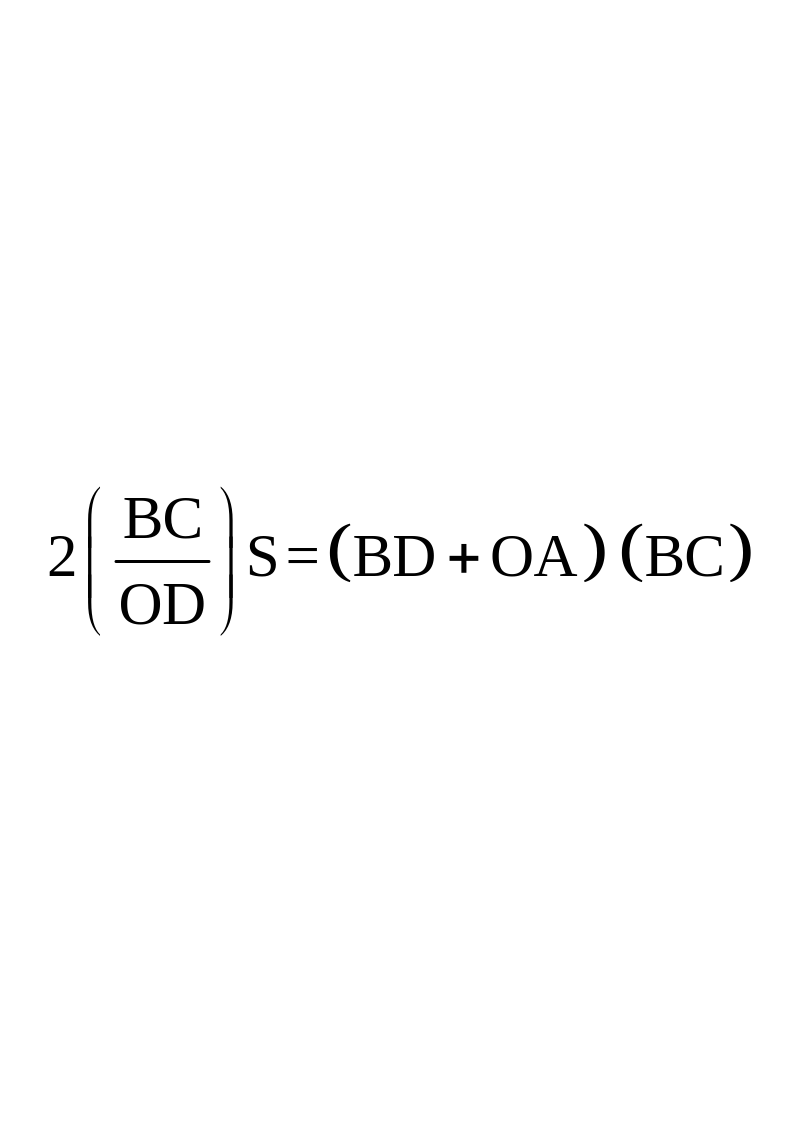
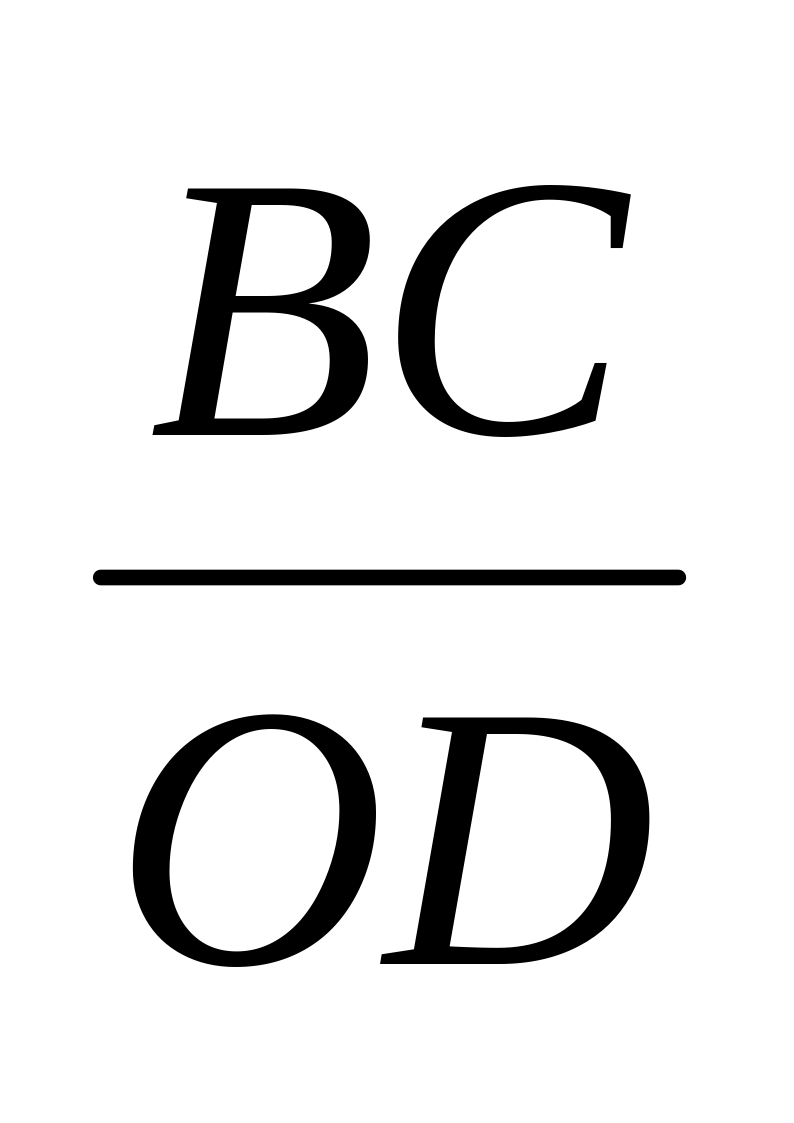
Multiplying both sides by , we get
As (BC = BD–CD)
As (= a)
2aS = (BD + OA ) (BD–CD)
As BD = vf
OA = vi
BD = vf
CD = vi
Putting the values in the in the above equation, we have
2 aS = (vf + vi) (vf – vi)
2aS = vf2 – vi2
This is called Third equation of motion.
Conclusion:
Short Questions
Q1. What are equations of motion?
EQUATIONS OF MOTION
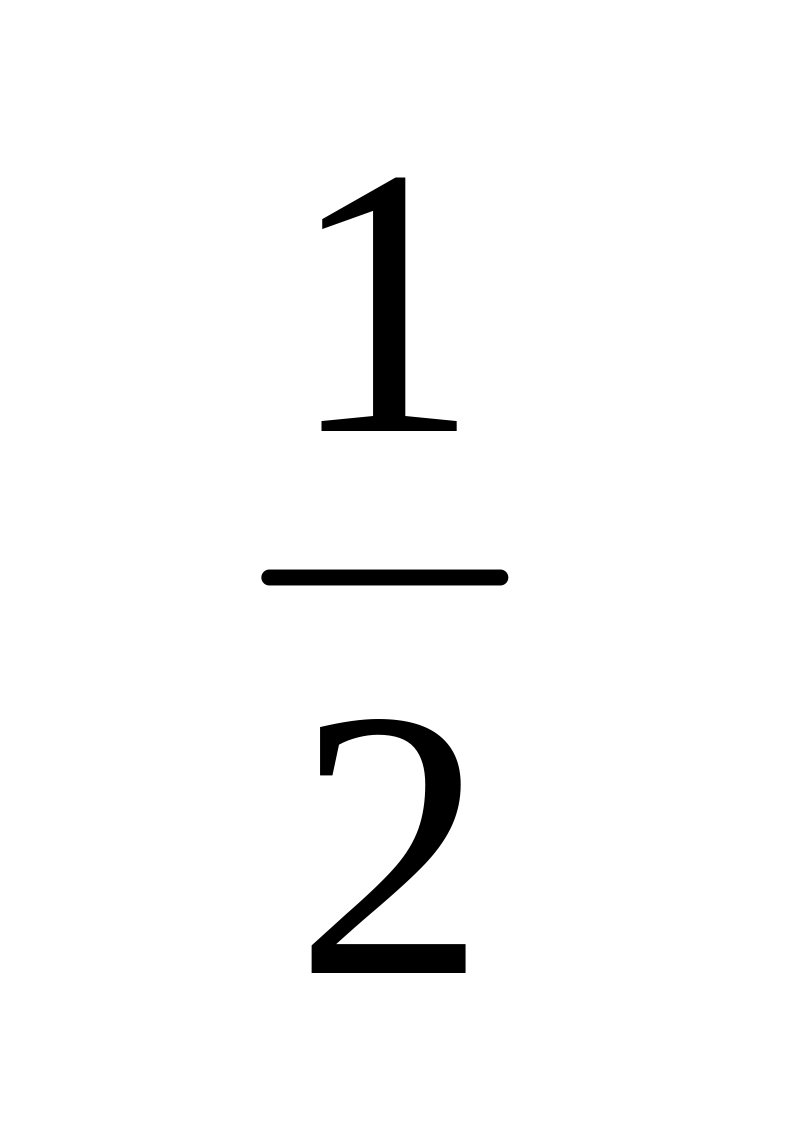
There are three basic equations of motion of bodies moving with uniform acceleration. These equations relate initial velocity vi, final velocity vf, acceleration a, time t and distance s covered by a moving body. In these equations of motion we suppose the motion of a body is along a straight line. Hence, we consider only the magnitude of displacements, velocities, and acceleration along straight line. For rectilinear motion equations of motion are as follows:
vf = vi + at
S = vit + at2
2aS = vf2 – vi2
Q2. Write formulae to find area rectangle, triangle and trapezium.
FORMULAE
Formulae for the areas of different shapes are given below:
Area of the rectangle = (width x length)
Area of the triangle ABC = (width x length)
Q3. How to convert ms–2 to kmh–2? (USEFUL INFORMATION Pg. # 47)
ms–2 TO kmh–2
To convert ms–2 to kmh–2 multiply acceleration inms–2 by {(3600×3600)/1000} = 12960 to get its value in kmh–2
Q4. How to convert kmh–2 to ms–2? (USEFUL INFORMATION Pg. # 47)
kmh–2 TO ms–2
Divide acceleration in kmh–2 by 12960 to get its value in ms–2.
Q5. How to convert ms–1 into kmh–1?
ms–1 TO kmh–1
Multiply speed in ms–1 by 3.6 to get speed in kmh–1
For example:
20ms–1 = 20×3.6 kmh–1
=72 kmh–1
EXAMPLE 2.10
Q6. A car travelling at 10ms–1 accelerates uniformly at 2ms–2. Calculate its velocity after 5 s.
Given Data:
Initial velocity = vi = 10ms–1
Acceleration = a = 2ms–2
Time = t = 5 s
To Find:
Final velocity = vf = ?
Calculations:
We know
vf = vi + at
Putting the values
vf = (10) + (2) (5)
vf = 10 + 10
vf = 20 ms–1
Result:
EXAMPLE 2.11
Q7. A train slows down from 80 kmh–1 with a uniform retardation of 2 ms–2. How long will it take to attain a speed of 20 kmh–1?
Given Data:
Initial velocity = vi = 80 kmh–1
Final velocity = vf = 20 kmh–1
Acceleration = a = –2ms–2
To Find:
Time taken = t =?
Calculations:
We know
vf = vi + at
Putting the values
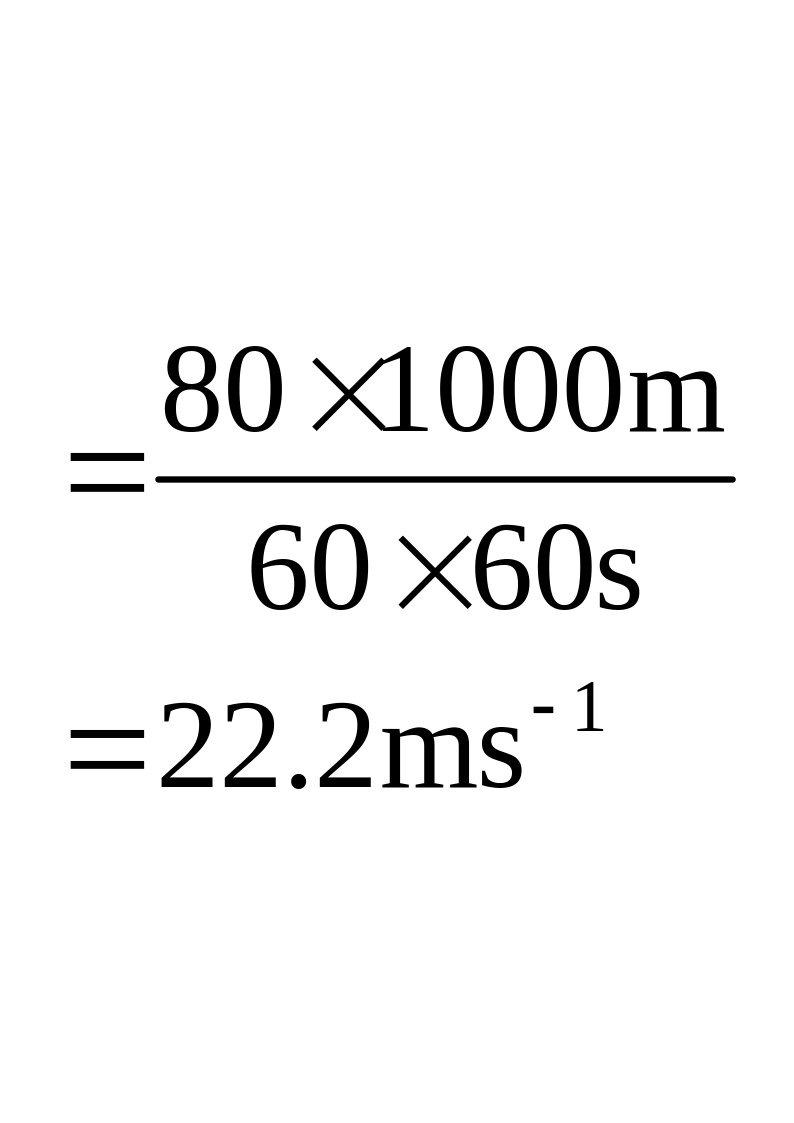
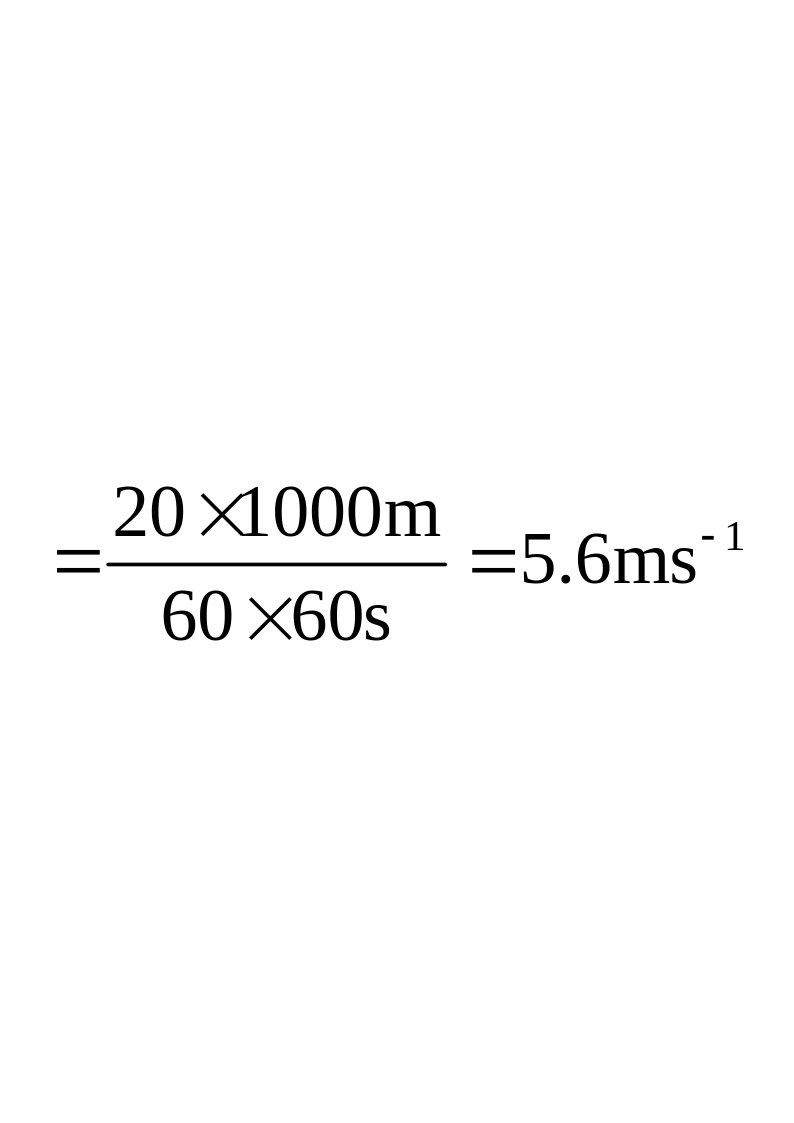
5.6 = (22.2) + (–2) (t)
5.6 – 22.2 = –2 t
–16.6 = –2t
t = 16.6 / 2
t = 8.3 s
Result:
EXAMPLE 2.12
Q8. A bicycle accelerates at 1 ms–2 from an initial velocity of 4 ms–1 for 10 s. Find the distance moved by it during this interval of time.
Given Data:
Acceleration = a = 1ms–2
Initial velocity = vi = 4ms–1
Time = t = 10s
To Find:
Distance moved = S = ?
Calculations:
We know
S = vit + ½ at2
Putting values
S = (4) (10) + ½ (1)(10)2
S = 40 + 50
S = 90m
Result:
EXAMPLE 2.13
A car travels with a velocity of 5 ms–1. It then accelerates uniformly and travels a distance of 50 m. If the velocity reached is 15 ms–1, find the acceleration and the time to travel this distance. Solution:
Given Data:
Initial Velocity = vi = 5 ms–1
Final Velocity = vf = 15 ms–1
Distance = S = 50m
To Find:
Acceleration = a =?
Time to travel the distance = t =?
Calculations:
We use 3rd equation of motion for finding acceleration
2 a S = vf2 – vi2
2 a (50) = (15)2 – (5)2
100 a = 225 –25
100 a = 200
a = 200/100
a = 2ms–2
We can find time to travel by using 1st equation of motion
As vf = vi + at
Putting the values
(15) = (5) + (2) t
15 – 5 = 2 t
10 = 2 t
t = 10/2
t = 5 s
Result:
2.7 Motion Of Free Falling Bodies
Long Questions
Q1. What do you know about gravitational acceleration? (LHR 2011)
GRAVITATIONAL ACCELERATION
Definition:
“The uniform acceleration of free falling bodies under the action of force of gravity is called gravitational acceleration.”
Discovery:
Galileo was the first scientist to notice that all the free falling objects have the same acceleration independent of their masses. He dropped various objects of different masses from the leaning tower of Pisa. He noticed that all of them reach the ground at the same time.
Explanation:
If we neglect air resistance, then all the bodies either lighter or heavier will fall down with uniform acceleration. This uniform acceleration of freely falling bodies is known as gravitational acceleration. It is represented by ‘g’. Its value is 9.8ms–2, but for simplicity we shall use the value of “g” as 10 ms–2. For bodies falling vertically downward ‘g’ is positive and for bodies moving vertically upward ‘g’ is negative.
Short Questions
Q1. How can we use equations of motion for bodies, which are falling freely under the gravity?
FREE FALLING BODIES
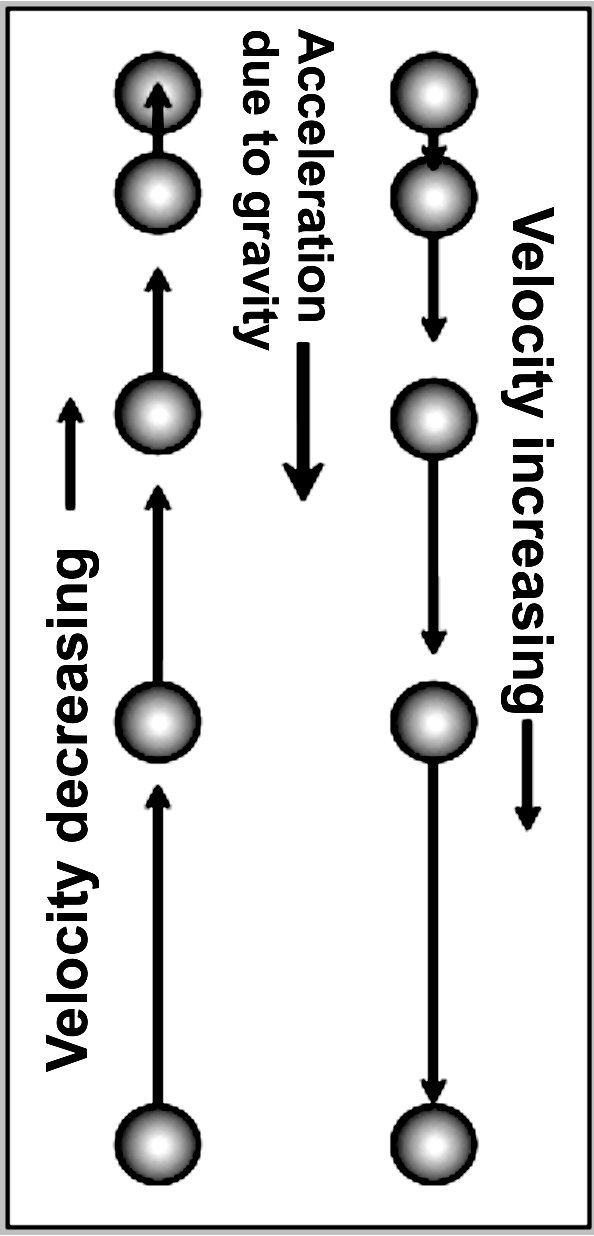
Equations of motion can be used for bodies moving under gravity. In such cases we replace ‘a’ by ‘g’ and S by h. so equations of motion for bodies falling freely can be written as,
vf = vi + gt
h = vit + gt2
2gh = vf2 – vi2
Q2. What are the points kept in mind when bodies are moving freely under gravity?
FOR DOWNWARD MOTION
Initial velocity ‘vi’ of the freely falling body will be zero
Gravitational acceleration will be positive
FOR UPWARD MOTION
Final velocity ‘vf’ of the body will be zero.
Gravitational acceleration will be negative.
Q3. When a body is thrown vertically upward, its velocity at the highest point is zero. Why?
VELOCITY AT HIGHTEST POINT
When a body is thrown vertically upward, it moves against the force of attraction of the
Earth. It slows down gradually and on reaching the highest point it comes to rest. That is why the velocity of a body becomes zero at the highest point.
EXAMPLE 2.14
A stone is dropped from the top of a tower. The stone hits the ground after 5 seconds. Find:
(a) The height of the tower
Q4. (b) The velocity with which the stone hits the ground.
Given Data:
Initial velocity = vi = 0
Gravitational acceleration = g = 10ms–2
Time = t = 5 s
To Find:
Height of tower = S = h = ?
Final Velocity = vf = ?
Calculations:
We can find height of the tower by using 2nd equation of motion
h = vit + ½ gt2
By putting values
h = (0)(5) + ½ (10)(5)2
h = 0 +125
h = 125 m
We can find final velocity of the stone by using 3rd equation of motion
2gh = vf2 – vi2
By putting values
2(10)(125) = vf2 – 0
vf2 = 2500
Taking square root on both sides
vf = 50 ms–1
Result:
EXAMPLE 2.15
A boy throws a ball vertically up. It returns to the ground after 5 seconds. Find
Q5. (a) The maximum height reached by the ball.
Given data:
Gravitational acceleration = g = –10ms–2 (As the ball is moving upward)
Time for up and down motion = to = 5 s
Velocity at maximum height = vf = 0
To Find:
Maximum height reached by the ball = h = ?
The velocity with which the ball is thrown up = vi = ?
Calculations:
For finding initial velocity first we have to find time to reach maximum height that is
Half of total time of flight (to)
So Time to reach maximum height = ½ to
t= ½ (5)
t = 2.5 s
Now by using 1st equation of motion we can find initial velocity
We know
vf = vi + at
Putting the values
0 = vi + (–10)(2.5)
0 = vi – 25
vi = 25ms–1
By using 3rd equation of motion we can find maximum height reached by the ball
We know
2gh = vf2 – vi2
By putting values
2(–10)h = 0 – (25)2
–20 h = –625
h = 625/20
h = 31.25 m
Result:
TB Text Book Exercise
Long Questions
Q1. Explain translatory motion and give examples of various types of translatory motion.
See Q.2 Long Question TOPIC 2.2
Differentiate between the following:
Rest and motion
Circular motion and rotatory motion
Distance and displacement (GRW 2014)
Speed and velocity (LHR 2013, 2015)
Scalars and vectors (GRW 2013, LHR 2014, 2015, 2107)
Q2. Define the terms speed, velocity, and acceleration. (GRW 2013, LHR 2015)
SPEED
Definition:
The distance covered by an object in unit time is called speed
Symbol:
Speed is represented by “v”
Quantity:
Speed is a scalar quantity. Its S.I unit is metre per second (ms–1)
Formula:
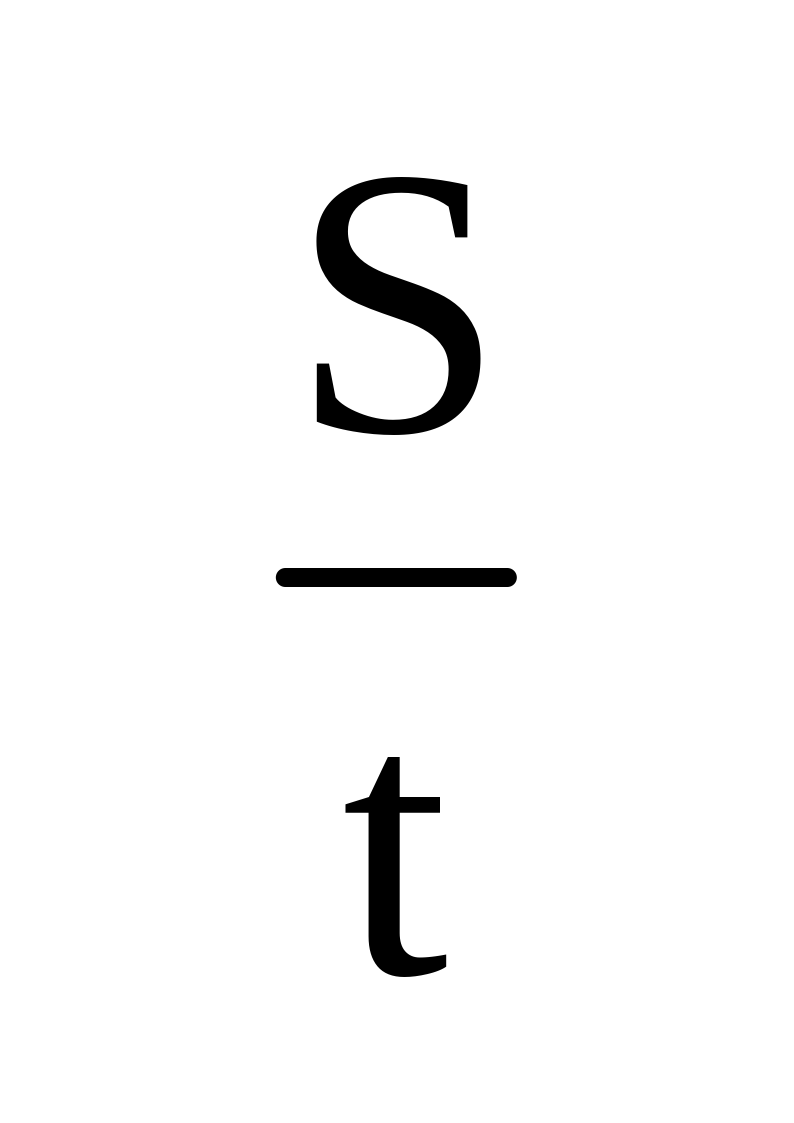
Speed= Distance covered/Total time
v =
VELOCITY
Definition:
“The displacement covered by an object in unit time is called velocity”
Symbol:
Displacement is denoted by “”
Quantity:
Speed is a scalar quantity. Its S.I unit is metre per second (ms–1)
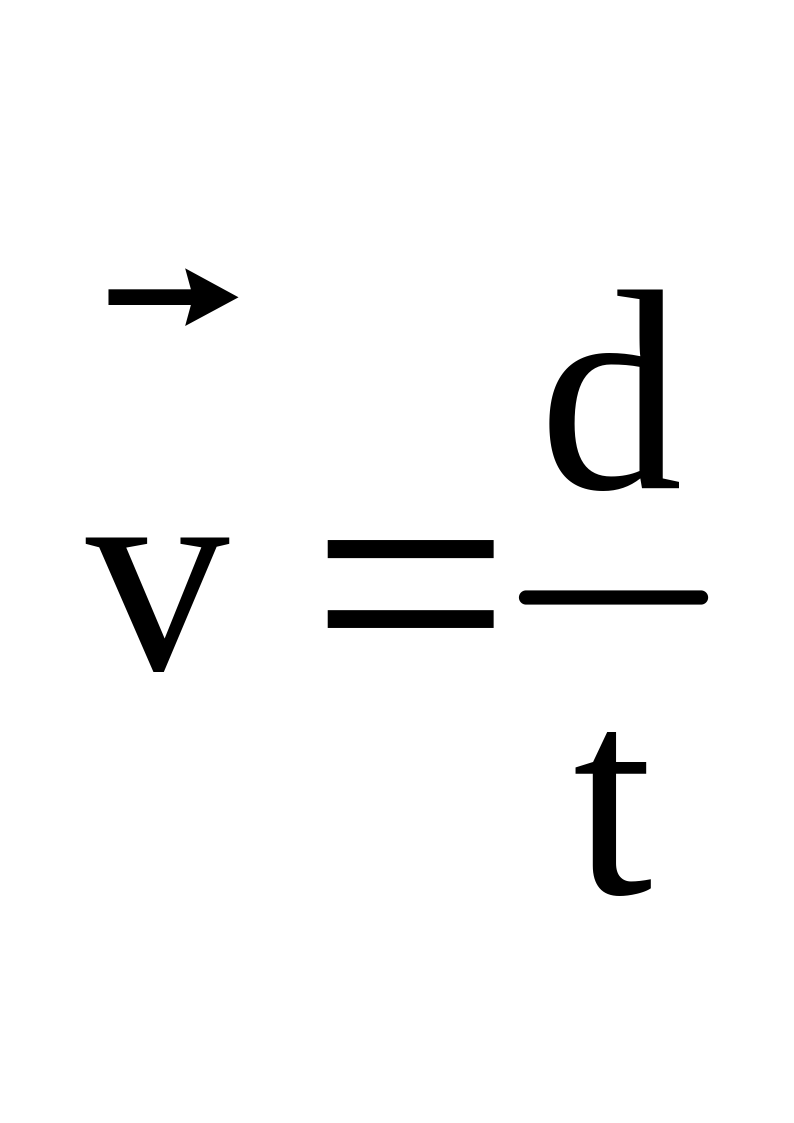
Formula:
ACCELERATION
Definition:
“The rate of change of velocity of a body is known as acceleration.”
Mathematical form:
If a body is moving with initial velocity ’vi’ and after some time ‘t’ its velocity becomes ‘vf’ then change in velocity will be vf–vi in time t.
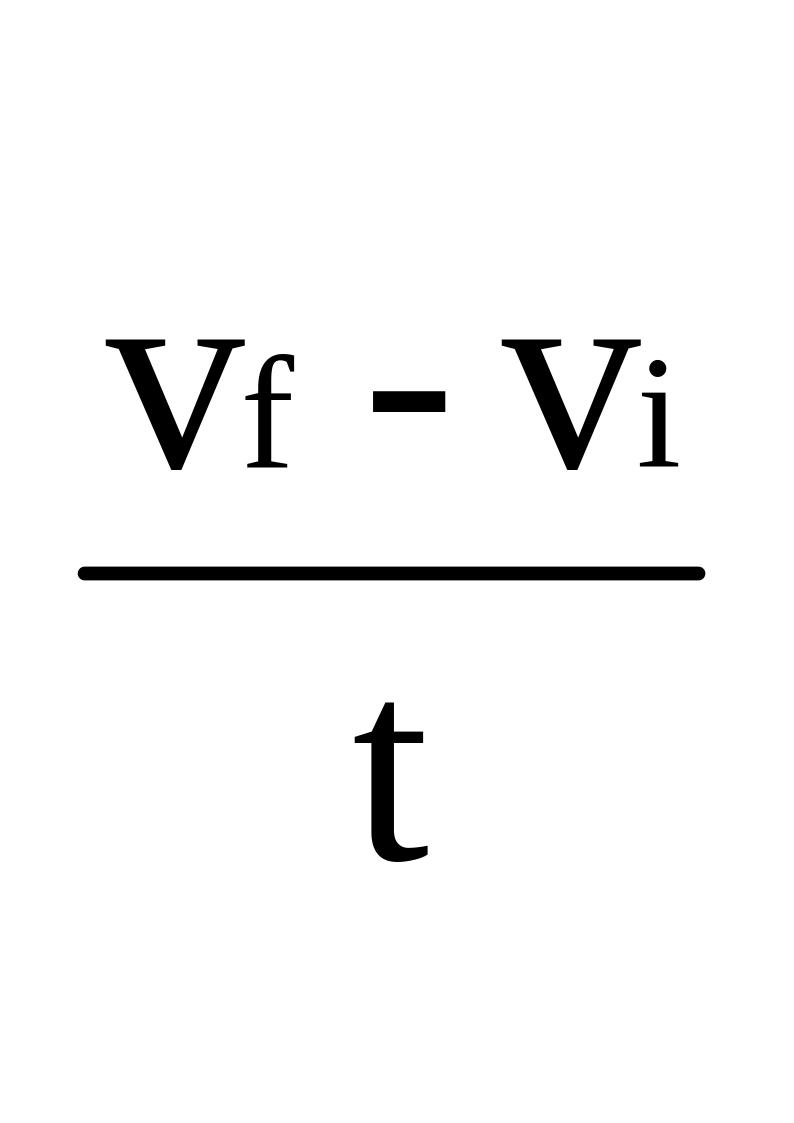
Acceleration =
Acceleration =
So a =
Unit:
SI unit of acceleration is meter per second per second (ms–2).
Quantity:
It is a vector quantity.
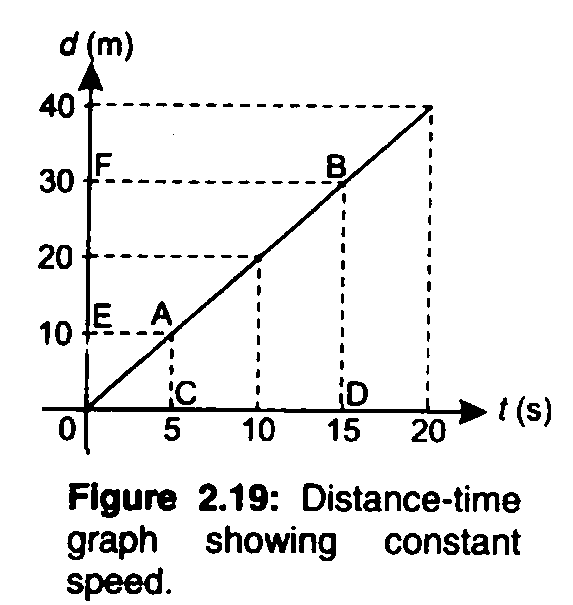
Q3. Sketch a distance – time graph for a body starting from rest. How will you determine the speed of a body from this graph?
DISTANCE TIME GRAPH
The distance–time graph is shown below:
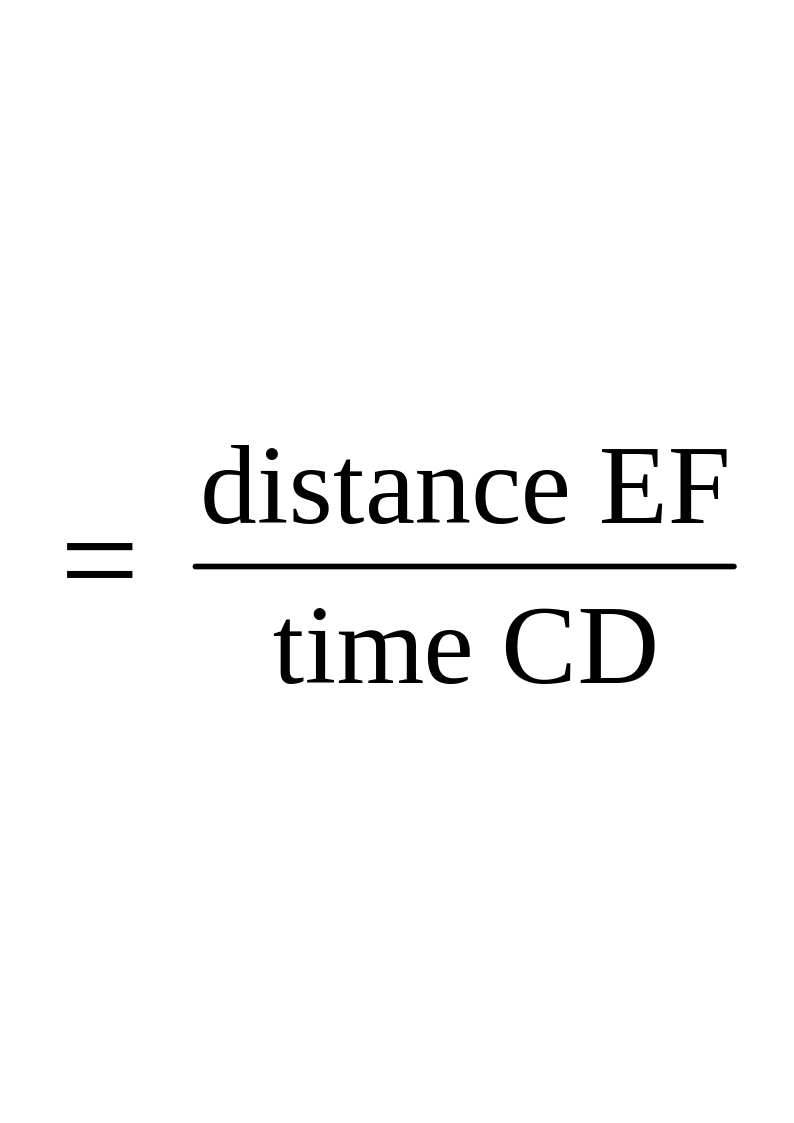
The slope of the graph gives speed with the help of the formula
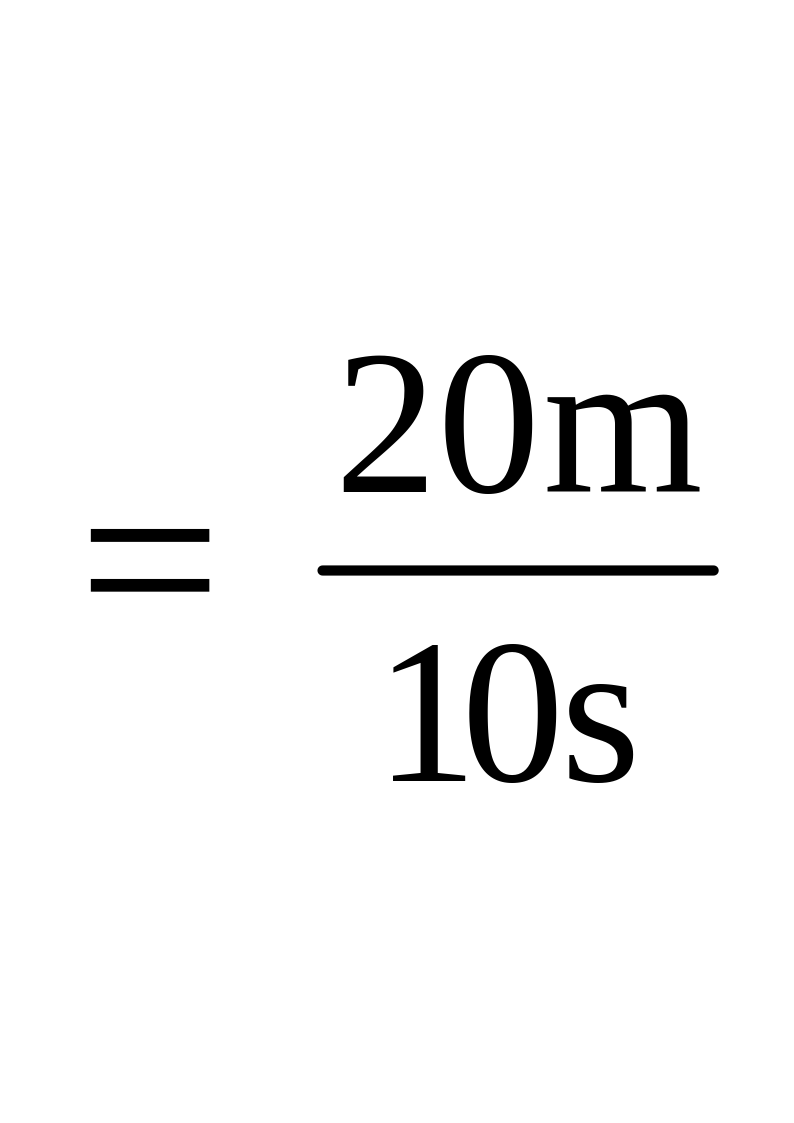
Speed (v) of the object = slope of line AB
= 2 ms–1
Result:
Q4. Derive equations of motion for uniformly accelerated rectilinear motion.
See Long Questions TOPIC 2.6
Sketch a velocity – time graph for the motion of the body. Calculate total distance covered by the body.
Q5. DISTANCE FROM VELOCITY TIME GRAPH
Given Data:
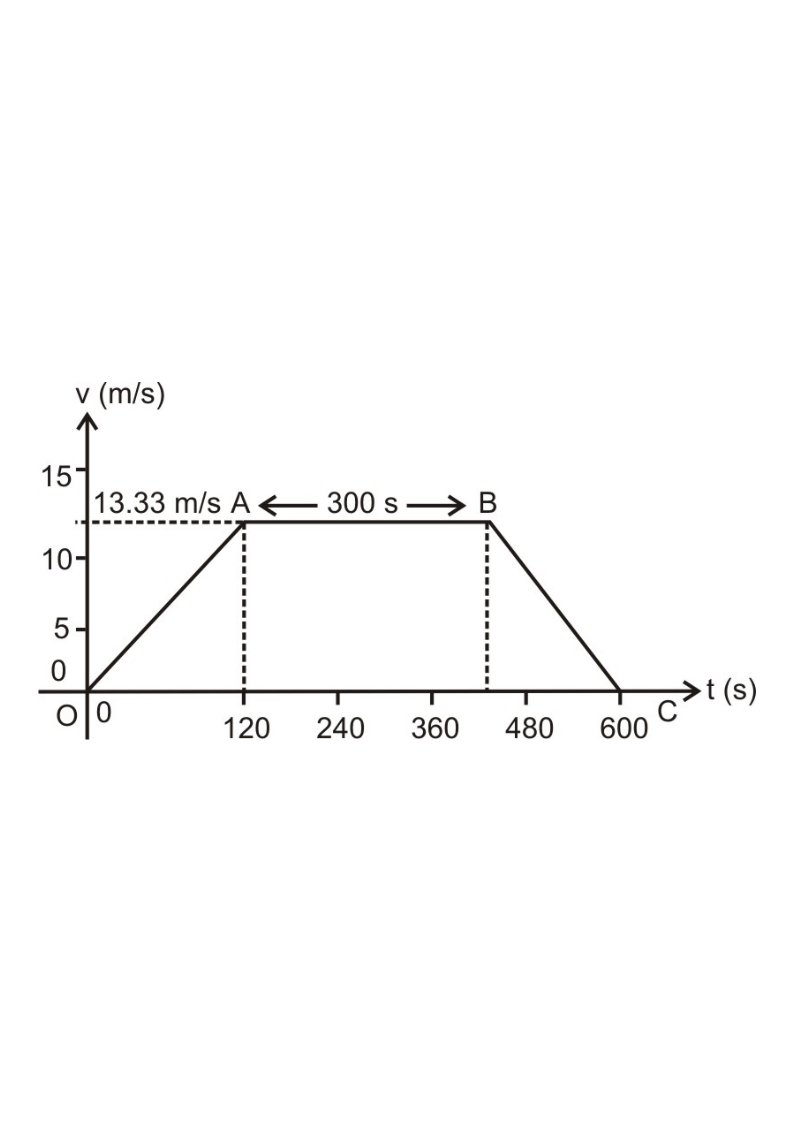
Velocity time graph for the calculation of total distance is given below?
To Find:
Total distance covered=?
Calculations:
By using the given values we plot a graph shown in figure.
Velocity = 48 kmh–1
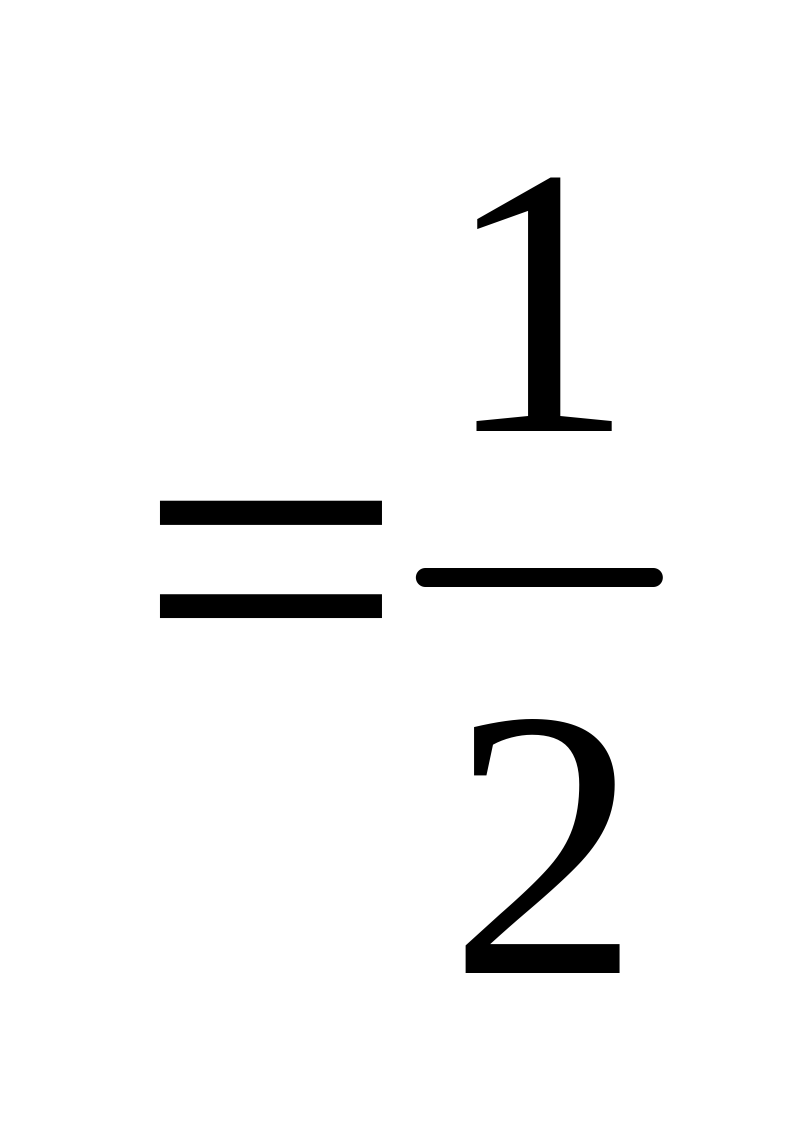
Velocity = 48 x1000
1000
Velocity = 13.33 ms–1
Time taken = 2 minutes
= 2(60)
= 120 s
Again time taken = 5 minutes
= 5(60)
= 300 s
Again time taken = 3 minutes
= 3(60)
= 180 s
We know that area under speed–time graph represents the distance covered by the object.
Total distance covered = Area of trapezium OABC
S (Sum of parallel sides) (Perpendicular distance between parallel sides)
S(600+300) (13.33)
S(900) (13.33)
S= 6000 m
Result:
Short Questions
Q1. Difference between Rest and Motion
DIFFERENTIATION
Differences between Rest and Motion are as follows:
| Rest | Motion |
| Definition | Definition |
| If a body does not change its position with respect to its surroundings then it is said to be in a state of rest. | If a body continuously changes its position with respect to its surroundings then it is said to be in a state of motion. |
| Examples | Examples |
| A person standing along the road is not changing his position w.r.t. His surroundings is in the state of rest. | Motion of earth about its geographical axis. |
Q2. Circular motion and rotatory motion.
DIFFERENTIATION
Differences between circulatory and rotatory motion are as follows:
| Circulatory Motion | Rotatory Motion |
| Definition | Definition |
| The motion of an object in a circular path is known as circular motion. | The spinning motion of a body about its axis is called rotatory motion. |
| Position of Axis | Position of Axis |
| In circular motion the point about which a body goes around is outside the body. | In rotatory motion the line around which a body moves about is passing through the body itself. |
| Examples | Examples |
| Motion of earth around the sun. Motion of individual particles of spinning top Motion of rider in Ferris Wheel |
Motion of earth about its geographical axis Spinning motion of top Motion of Ferris Wheel |
Q3. Difference between Distance and Displacement.
DIFFERENTIATION
Differences between distance and displacement are as follows:
| Distance | Displacement |
| Definition | Definition |
| Length of path between two points is called distance between those points. | The shortest distance between two points is called displacement |
| Symbol | Symbol |
| Distance is represented by “S” | Displacement is denoted by “” |
| Quantity | Quantity |
| Distance is a scalar quantity. Its S.I unit is metre | Displacement is a vector quantity. Its S.I unit is metre |
| Graphical Difference | Graphical Difference |
| Consider a body that moves from point A to point B along the curved path. Join points A and B by a straight line. The straight line AB gives the distance which is the shortest between A and B. This shortest distance has magnitude d and direction from point A to B. This shortest distance d in a particular direction is called displacement. It is a vector quantity and is represented by d. While any other length of path between A and B shows distance | Consider a body that moves from point A to point B along the curved path. Join points A and B by a straight line. The straight line AB gives the distance which is the shortest between A and B. This shortest distance has magnitude d and direction from point A to B. This shortest distance d in a particular direction is called displacement. It is a vector quantity and is represented by d. While any other length of path between A and B shows distance |
Q4. Difference between Speed and Velocity
DIFFERENTIATION
Differences between speed and velocity are as follows:
| Speed | Velocity |
| Definition | Definition |
| The distance covered by an object in unit time is called speed | The displacement covered by an object in unit time is called velocity |
| Symbol | Symbol |
| Speed is represented by “v” | Displacement is denoted by “” |
| Quantity | Quantity |
| Speed is a scalar quantity. Its S.I unit is metre per second (ms–1) | Speed is a scalar quantity. Its S.I unit is metre per second (ms–1) |
| Formula | Formula |
| Speed= Distance covered/Total time v = |
Q5. (v) Difference between Linear and Random motion.
DIFFERENTIATION
Differences between Linear and Random motion are as follows:
| Linear motion | Random motion |
| Definition | Definition |
| The translatory motion of the body in a straight line is called linear motion |
The disordered or irregular translatory motion of an object is called random motion |
| Examples | Examples |
| The motion of freely falling bodies Motion of a car moving along the straight line Motion of aeroplane on the straight runway. |
The flight of an insect and birds Brownian motion of gas or liquid molecules Motion of dust or smoke particles in air |
Q6. (vi) Difference between scalar and vector.
DIFFERENTIATION
Differences between scalar and vectors are as follows:
| Scalar Quantities | Vector Quantities |
| Definition | Definition |
| Physical quantities which can be completely described by their magnitude only are called scalar quantities or simply Scalars | Physical quantities which can be completely described by their magnitude along with their direction are called vector quantities or simply Vectors. |
| Addition/Subtraction | Addition/Subtraction |
| Scalar quantities can be added or subtracted by simple arithmetic rules because they have only numeric value with proper unit. | Vector quantities can–not be added or subtracted by simple arithmetic rules because they have direction along with numeric value and proper unit. They need head to tail rule for this purpose |
| Examples | Examples |
| Mass, length, time speed, volume, area, energy etc. |
Velocity, force, displacement, momentum, torque etc. |
Q7. Can a body moving at a constant speed have acceleration? (LHR 2014)
CONSTANT SPEED AND ACCELERATION
A body moving with constant speed may or may not have acceleration.
It will not have acceleration if the body is moving with constant speed in a straight line that will be case of constant velocity.
That body can have acceleration if its direction of motion changes continuously. For example a body moving with constant speed in a circular path has acceleration.
Q8. How do riders in a Ferris wheel possess translatory motion but not circular motion?
MOTION OF RIDER
Riders in a Ferris wheel move in a circle without rotation therefore motion of rider in Ferris wheel is translatory not rotatory.
Q9. What would be the shape of speed – time graph of a body moving with variable speed?
Long question Q. 2 Topic 2.5
Which of the following can be obtained from speed – time graph of a body?
Initial speed (ii) Final Speed
Q10. (iii) Distance covered in time t (iv) Acceleration of motion
INFORMATION FROM SPEED TIME GRAPH
All the given quantities can be obtained from speed–time graph.
Q11. How can vector quantities be represented graphically? (LHR 2014, GRW 2014)
Short question Q. 4 Topic 2.3 & 2.4
Q12. Why vector quantities cannot be added and subtracted like scalar quantities?
ADDITION AND SUBTRACTION
Scalar quantities can be described completely by magnitude only and can be added or subtracted by simple arithmetical rules. Vector quantities in addition to magnitude also need direction for their description. So vectors cannot be added or subtracted by arithmetic rules due to direction.
Q13. How are vector quantities important to us in our daily life?
IMPORTANCE OF VECTOR QUANTITIES
In order to locate a place from a reference point, we will have to describe the distance and direction of that place from reference point. Description of distance along with direction will make up a vector quantity. Hence by using vector quantities we can describe the position (or location) of bodies.
Numerical Problems
Numerical 1. A train moves with a uniform velocity of 36 kmh–1 for 10s. Find the distance traveled by it.
Given Data:
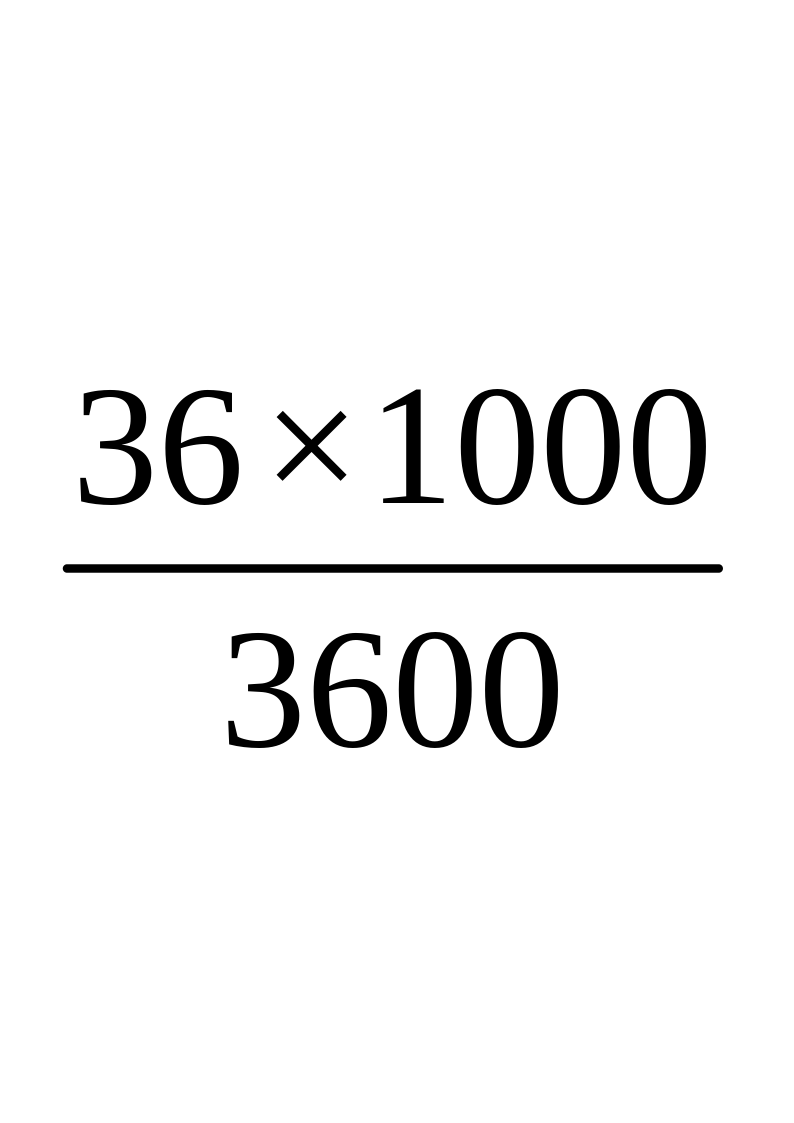
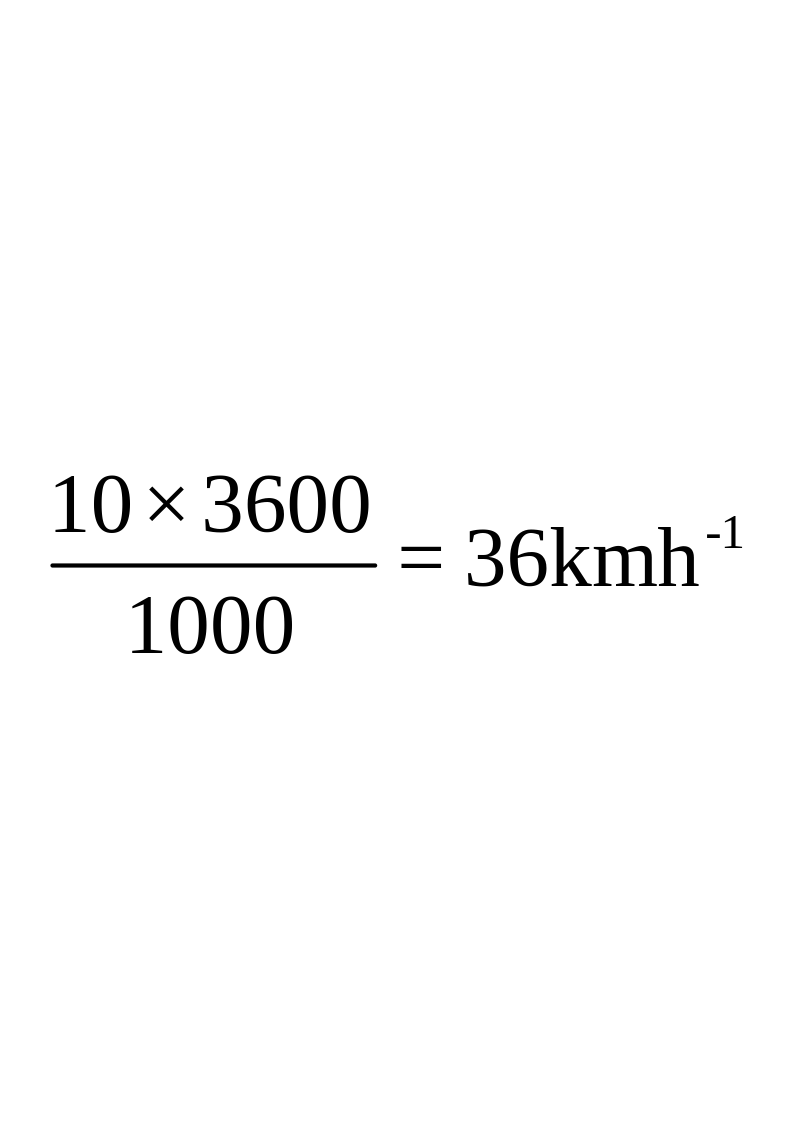
Velocity of train = Vav = 36 kmh–1 = = 10 ms–1
Time taken = t = 10 s
To Find:
Distance travelled by train = S = ?
Calculations:
As we know that
S = Vav x t
By putting the values, we have
S = 10 x 10
S = 100 m
Result:
Numerical 2. A train starts from rest. It moves through 1 km in 100s with uniform acceleration. What will be its speed at the end of 100s?
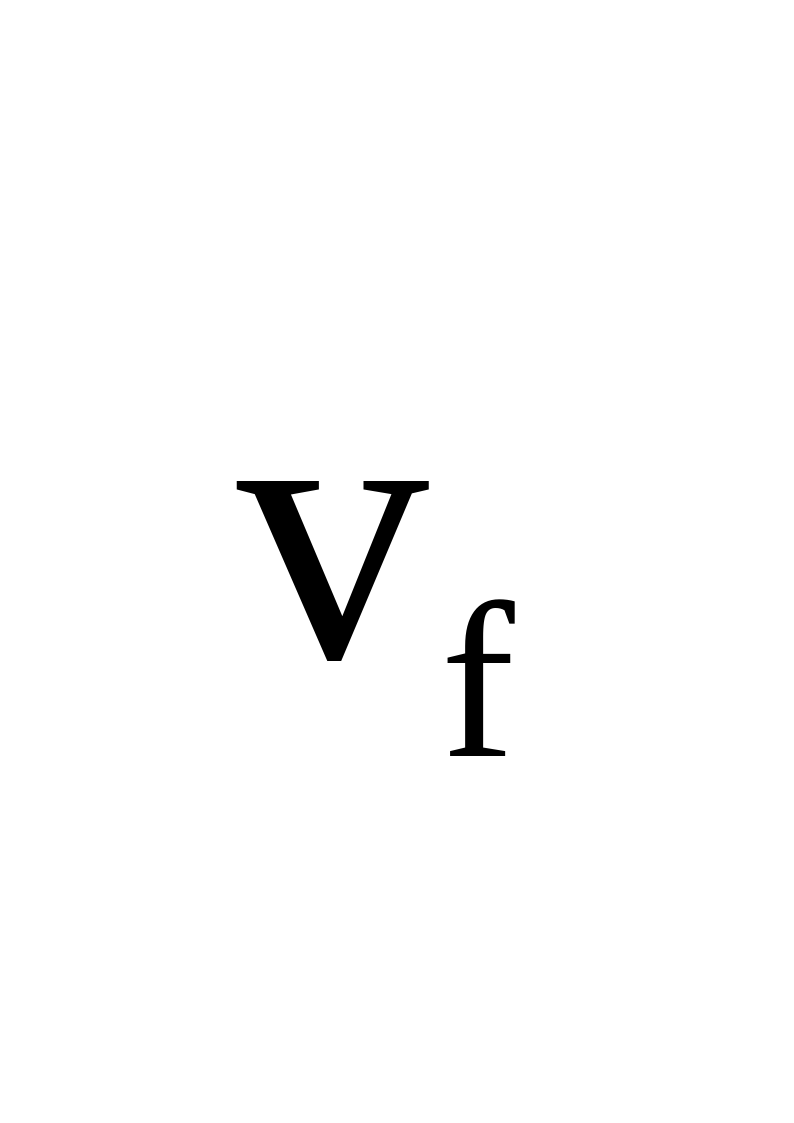
Given Data:
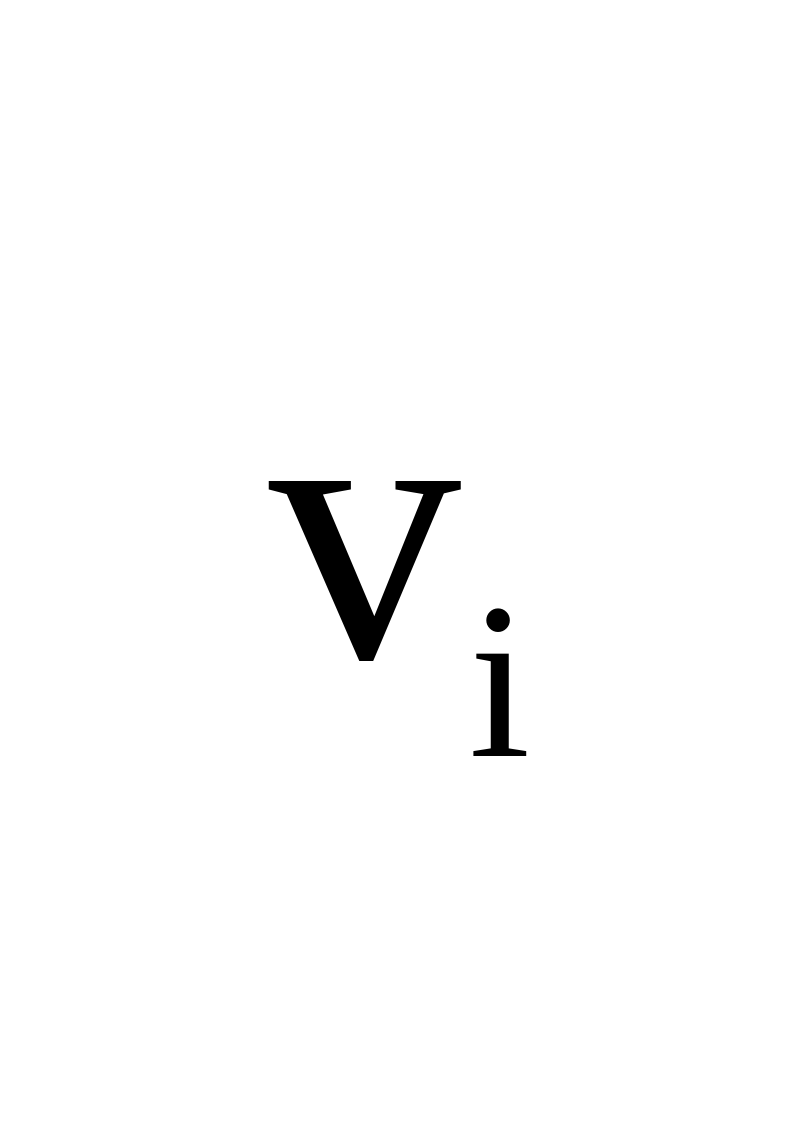
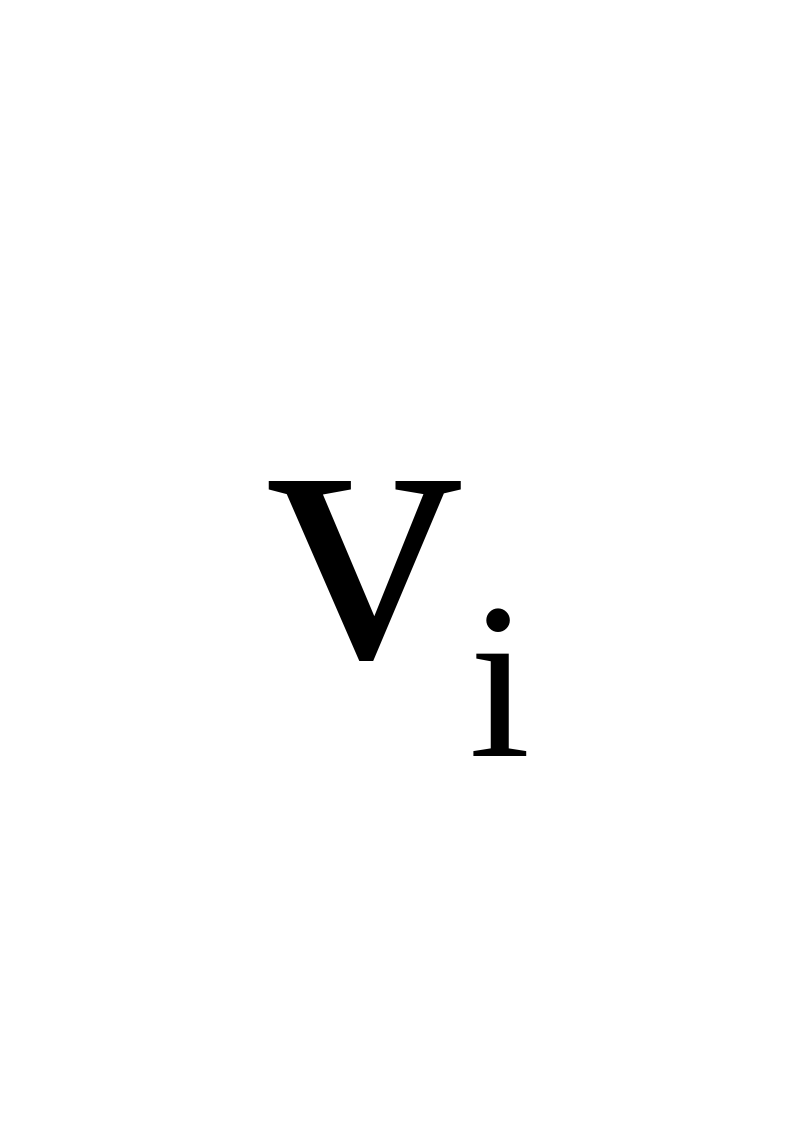
Initial velocity of train = = 0 ms–1
Distance covered by train = S = 1 km = 1000 m
Time taken by train = t = 100 s
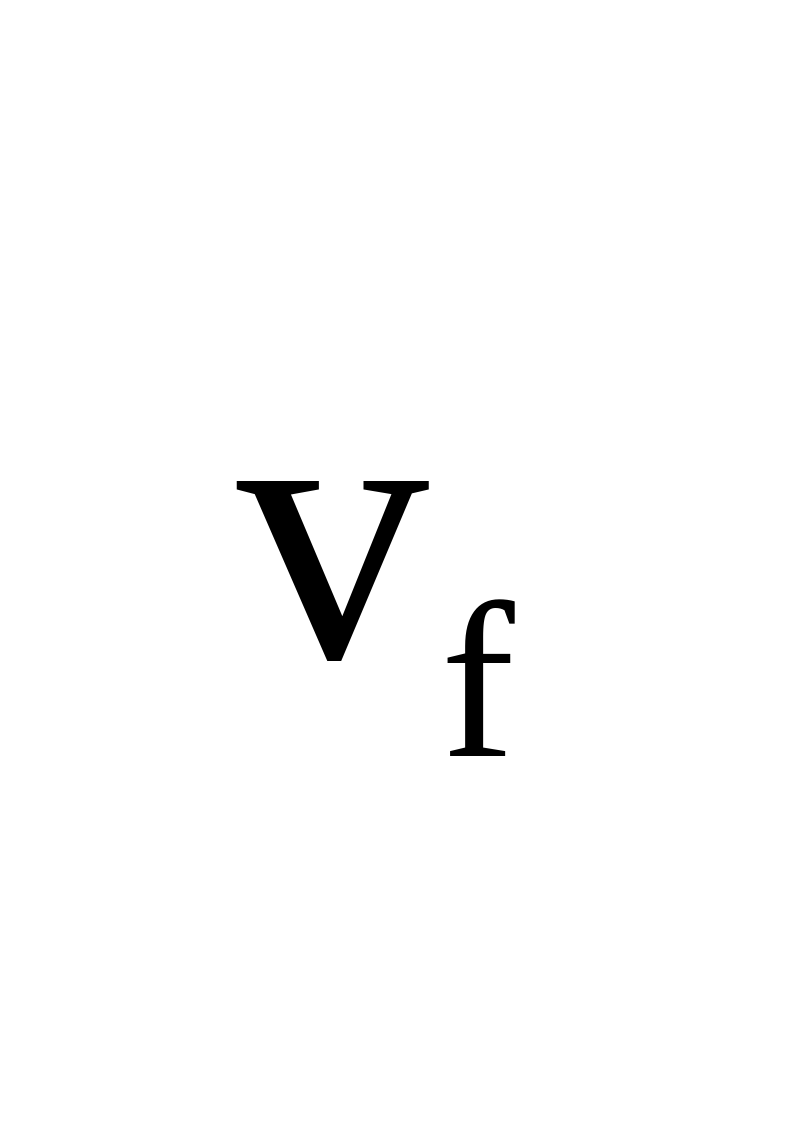
To Find:
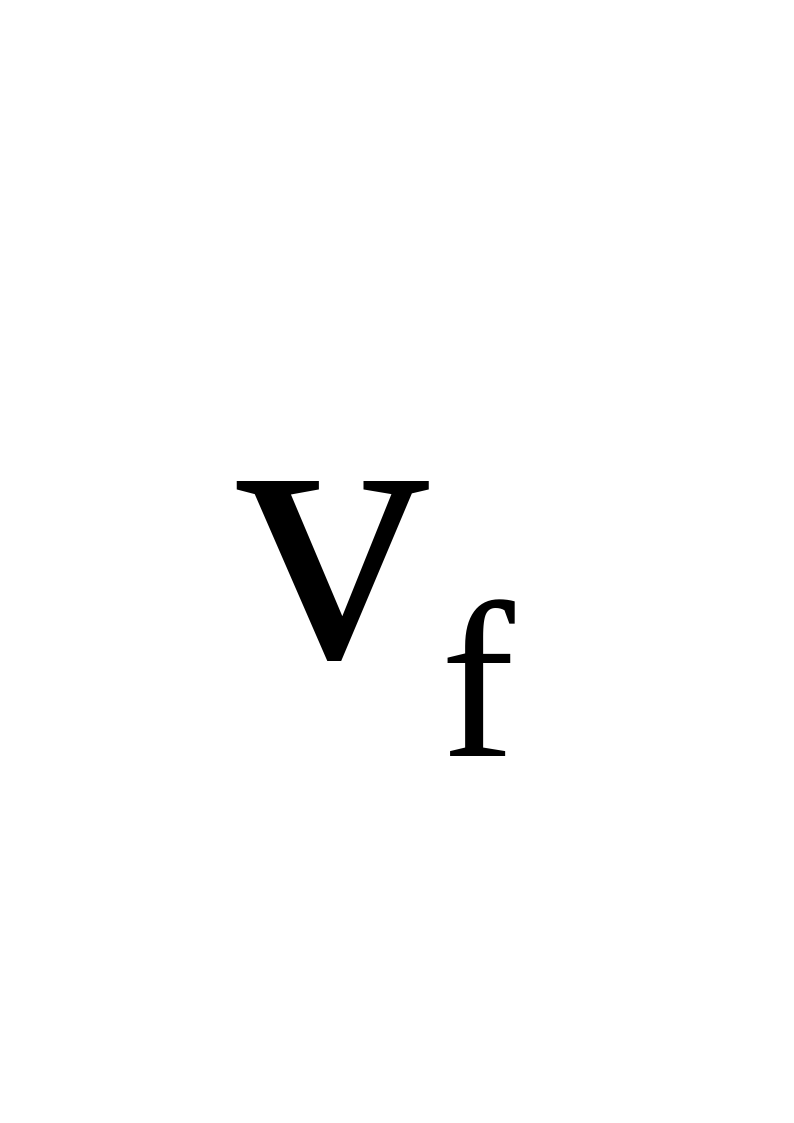
Speed of train after 100 s = = ?
Calculations:
First we have to find the acceleration, as we know that
S = t + ½ at2
By putting the values, we have
1000 = 0 x 100 + ½ x a x (100)2
1000 = ½ x a x 10000
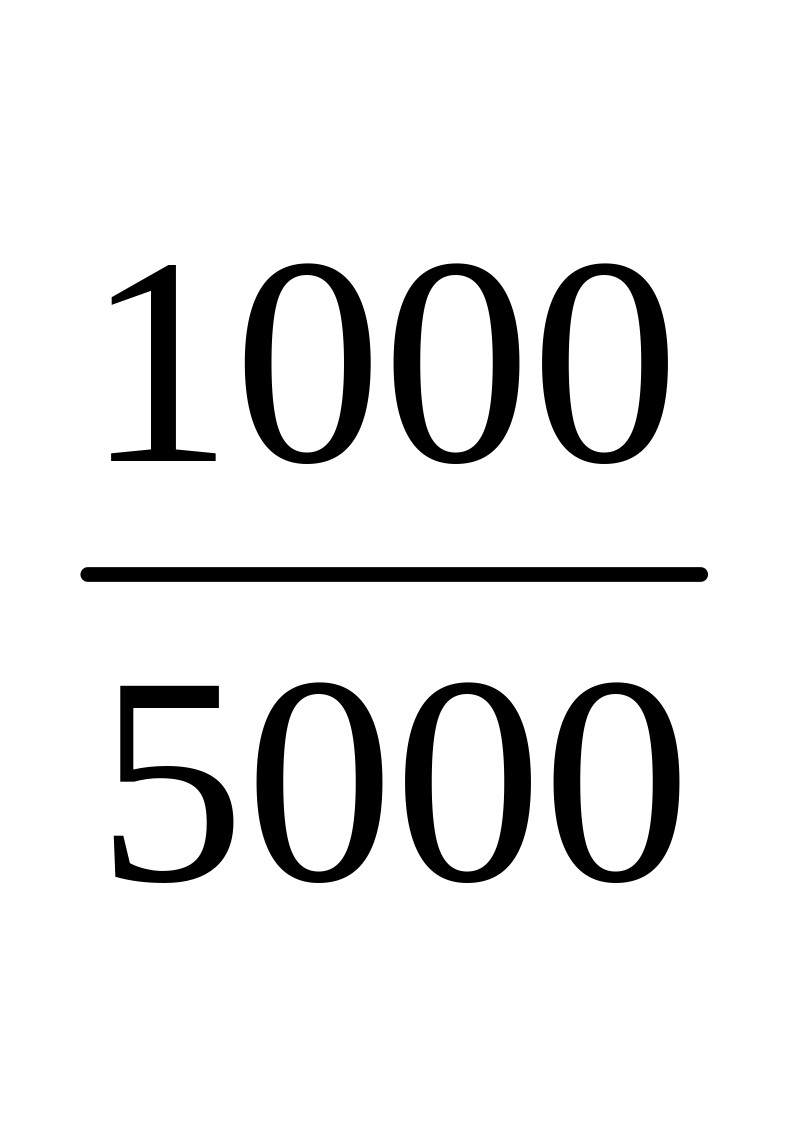
1000 = a x 5000
a =
So, a = 0.2 ms–2
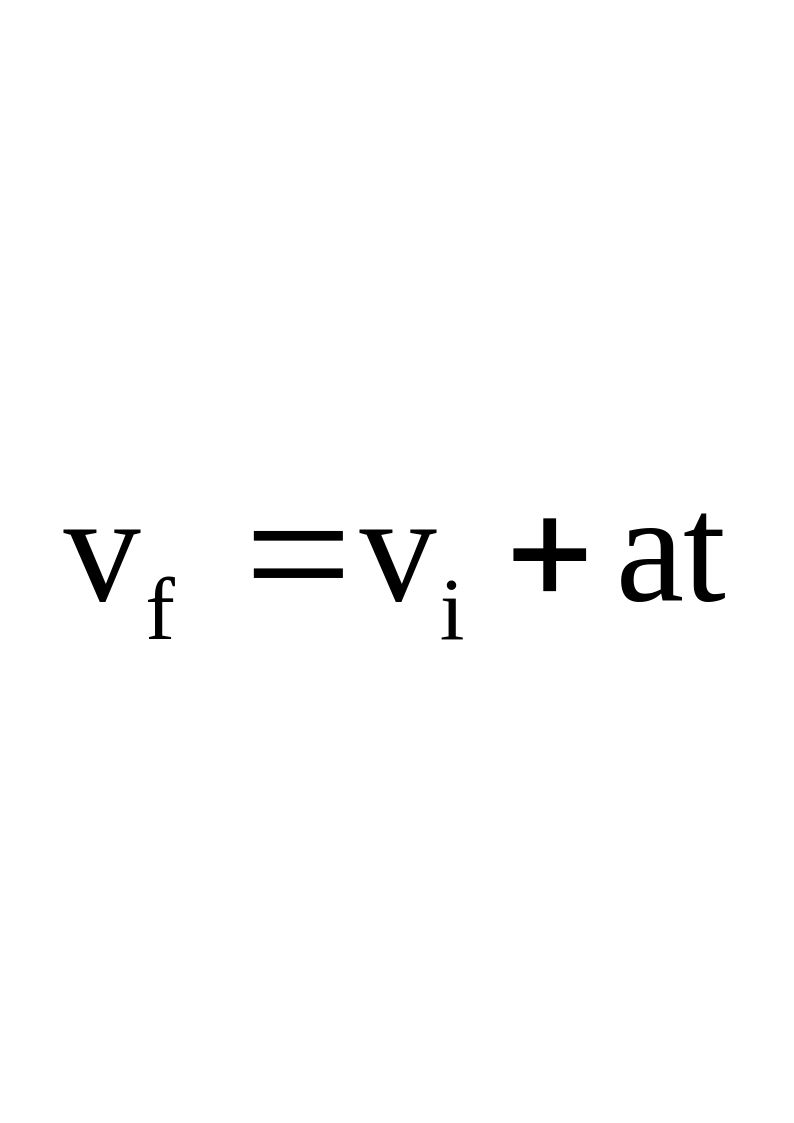
Now from first equation of motion, we have
by putting the values, we have
= 0 + 0.2 x 100
= 20 ms–1
Result:
Numerical 3. A car has a velocity of 10 ms–1. It accelerates at 0.2 ms–2 for half minute. Find the distance travelled during this time and the final velocity of the car.
Given Data:
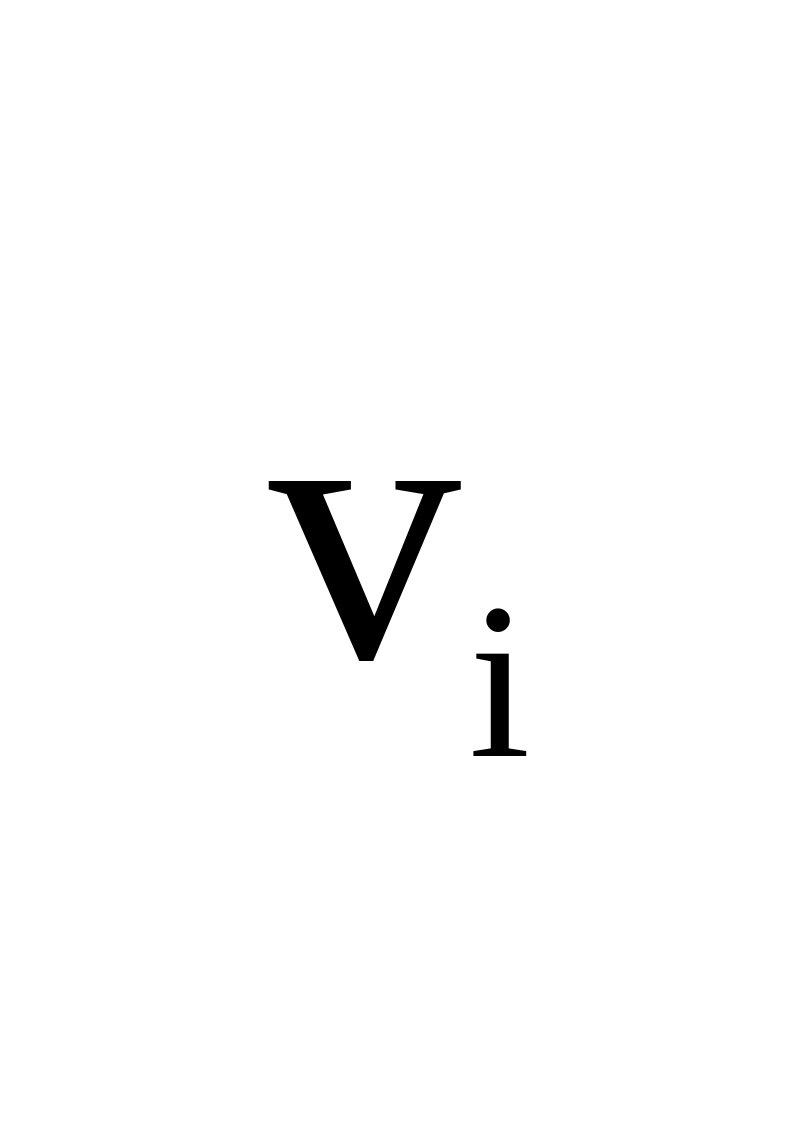
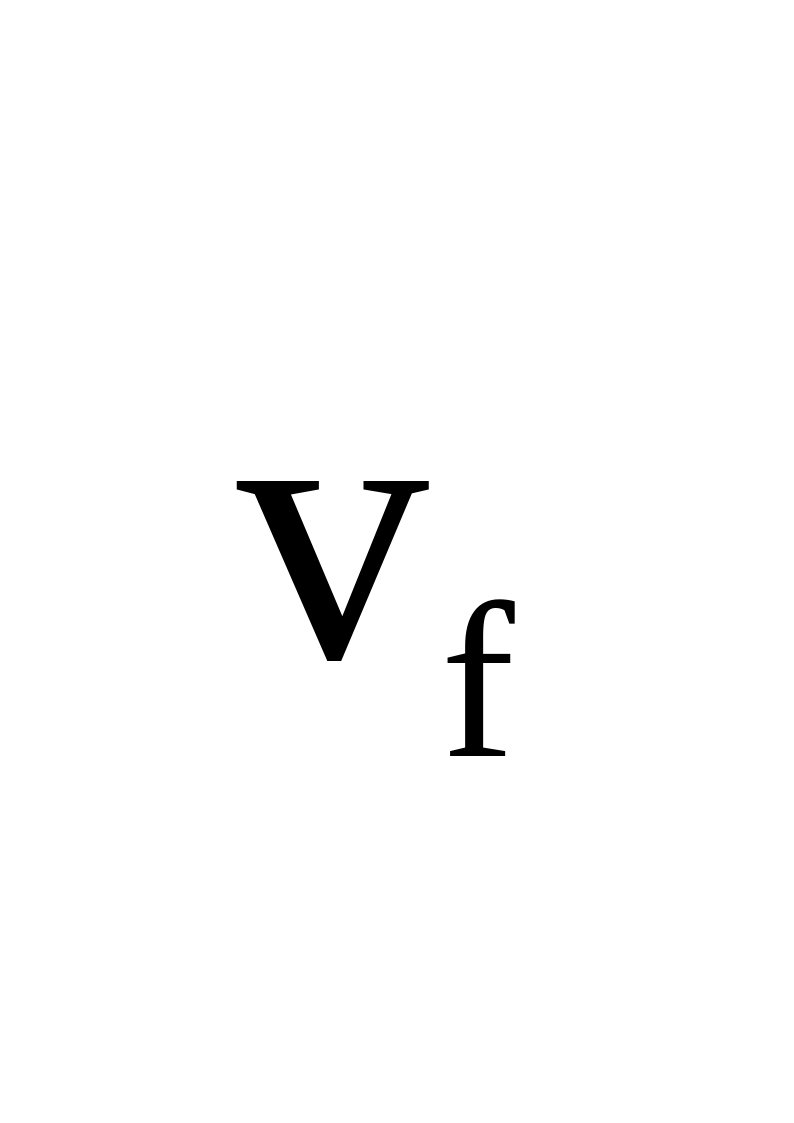
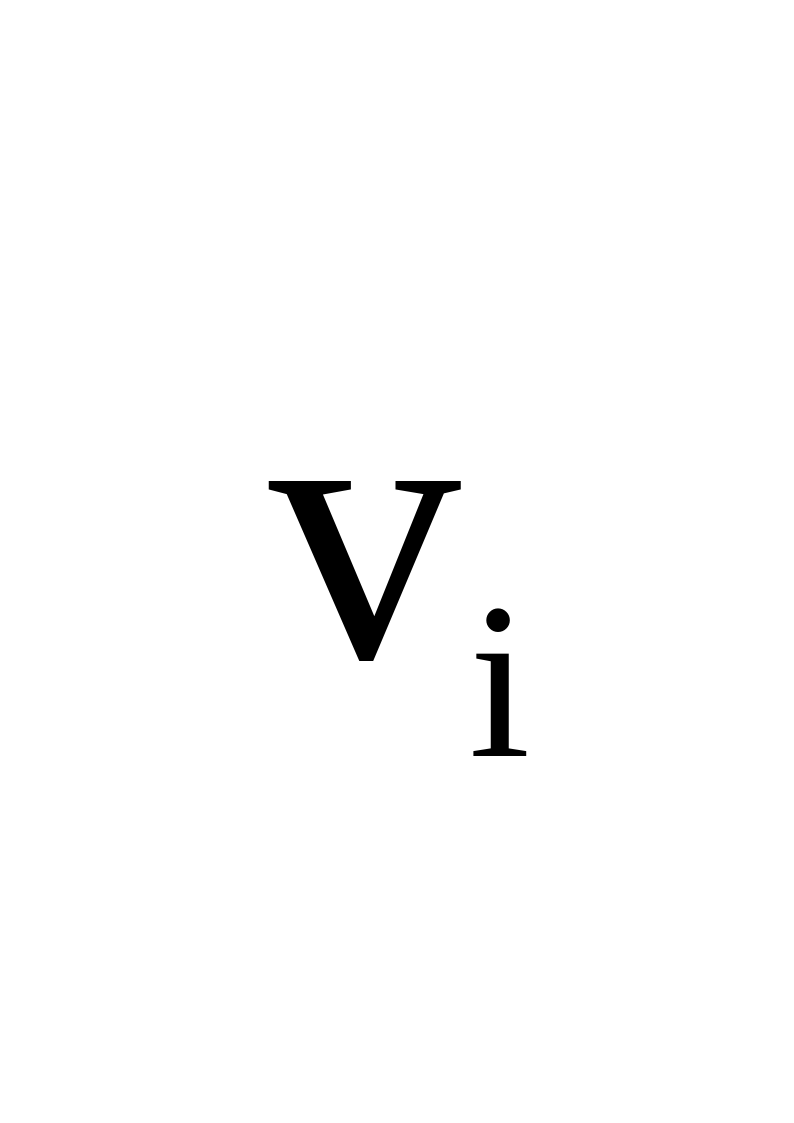
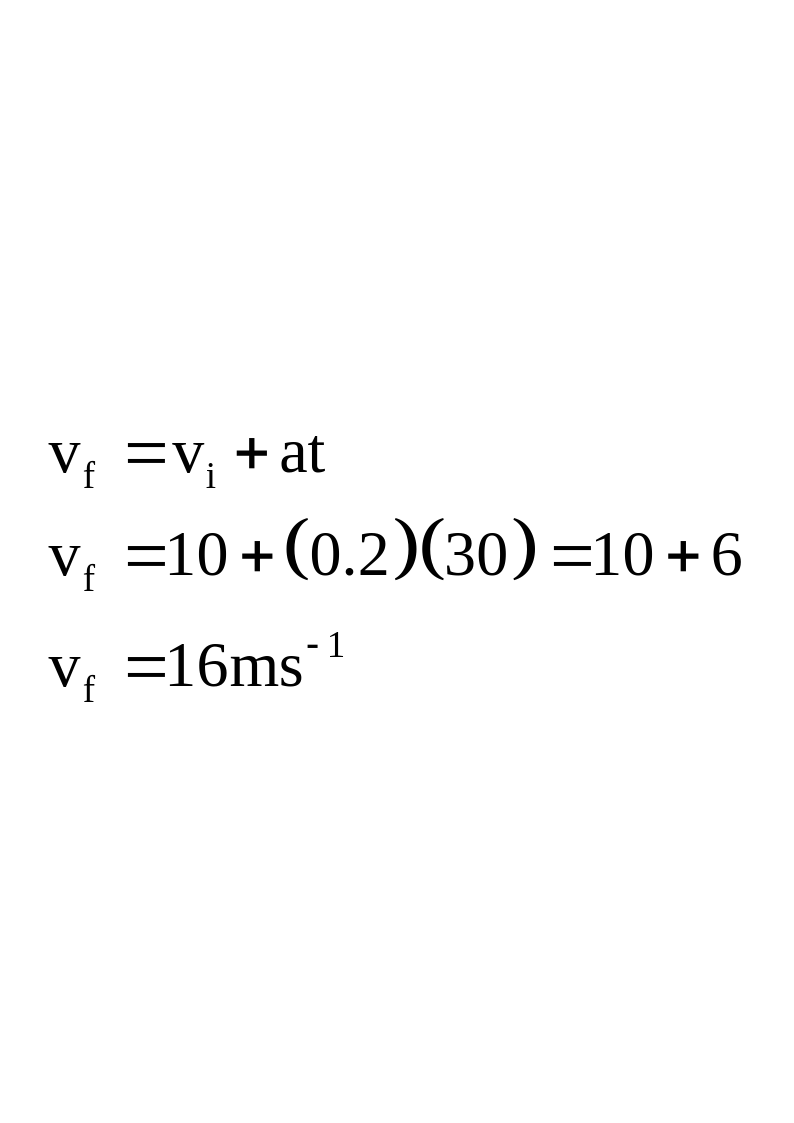
Velocity of the car = = 10 ms–1
Acceleration of the car = a = 0.2 ms–2
Time taken by car = t = 0.5 min. = 0.5 x 60 = 30 s
To Find:
(a) Distance traveled by car = S = ?
(b) Final velocity of the car = = ?
Calculations:
As we know that
S = t + ½ at2
By putting the values, we have
S = 10 x 30 + ½ x 0.2 x (30)2
S = 300 + 0.1 x 900
S = 300 + 90
S = 390 m
(b) Now, by using first equation of motion, we have
Result:
Numerical 4. A tennis ball is hit vertically upward with a velocity of 30 ms–1. It takes 3 s to reach the highest point. Calculate the maximum height reached by the ball. How long it will take to return to ground?
Given Data:
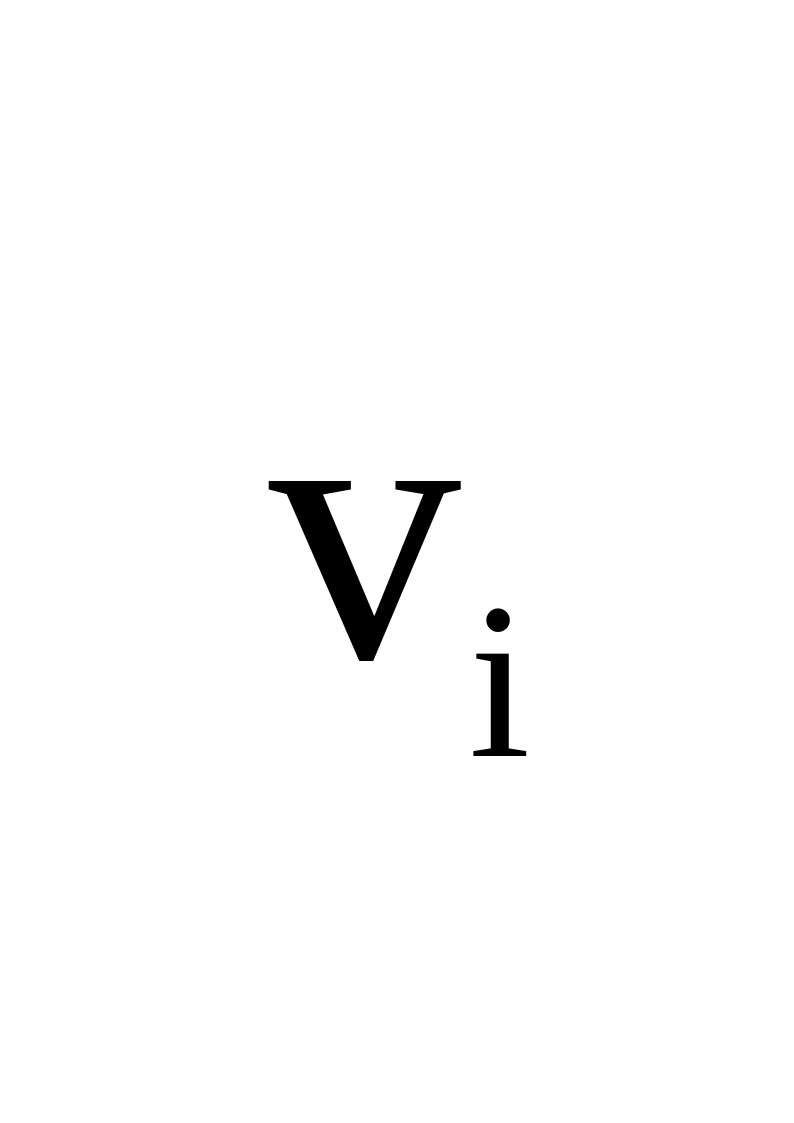
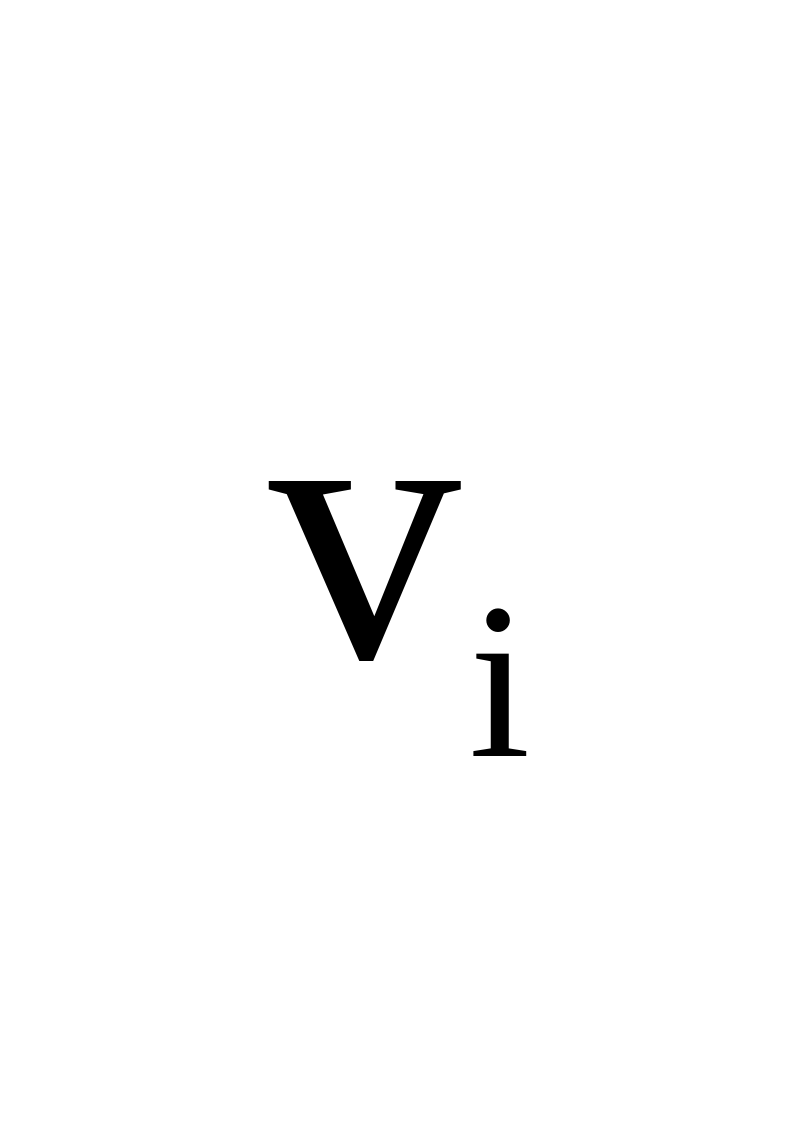
Initial velocity of the tennis ball = = 30 ms–1
Time to reach the maximum height = t = 3 s
Gravitational acceleration = g = –10 ms–2
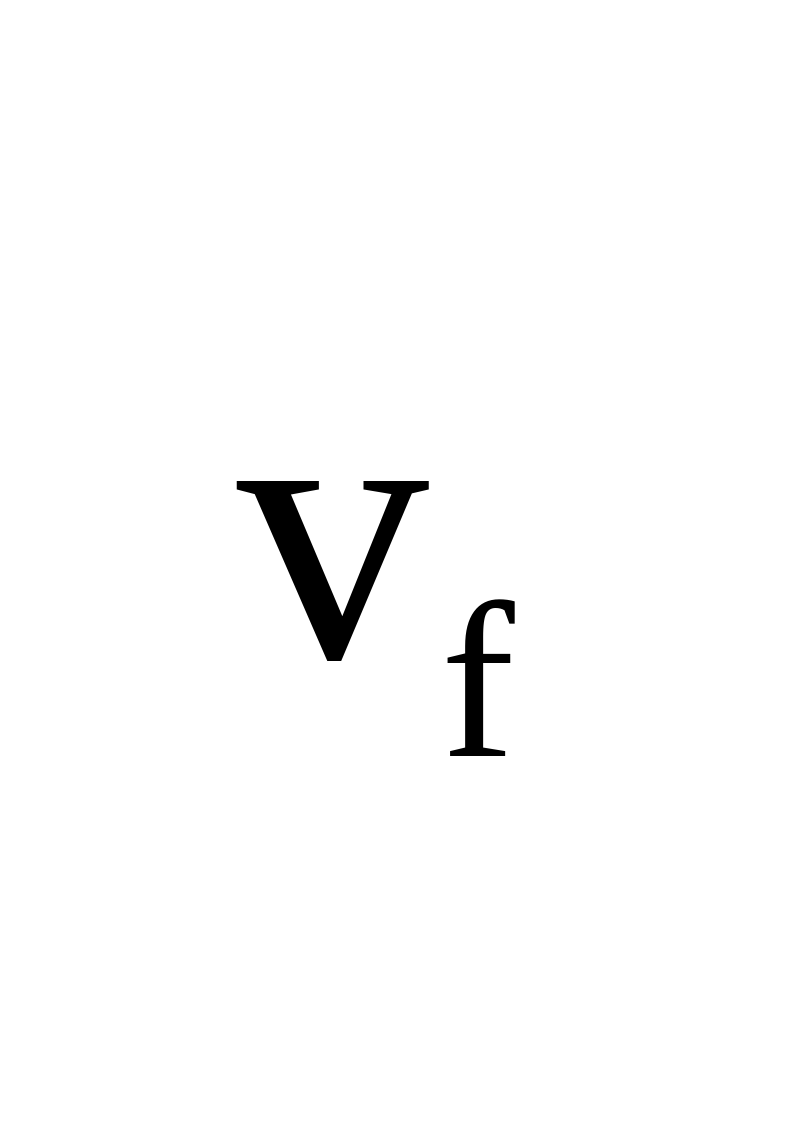
Final velocity of the ball = = 0ms–1
To Find:
Maximum height reached by the ball = h = ?
Calculations:
From second equation of motion in vertical motion, we have
h = t + ½ gt2
by putting the values, we have
h = 30 x 3 + ½ x (–10) (3)2
h = 90 – 5 x 9 h = 90 – 45 h = 45 m
As the ball moves with uniform acceleration in vertical motion, so time taken by the ball in both directions will be same.
Total time taken to return the ground = Time taken upwards + Time taken downwards
Total time taken to return the ground = 3 s + 3s
Total time taken to return the ground = 6 s
Result:
Numerical 5. A car moves with uniform velocity 40 ms–1 for 5 s. it comes to rest in the next 10 s with uniform declaration. Find i) declaration ii) total distance traveled by the car
Given Data:
For uniform motion:
Uniform velocity = vav = 40ms–1
Time for uniform velocity = t =5s
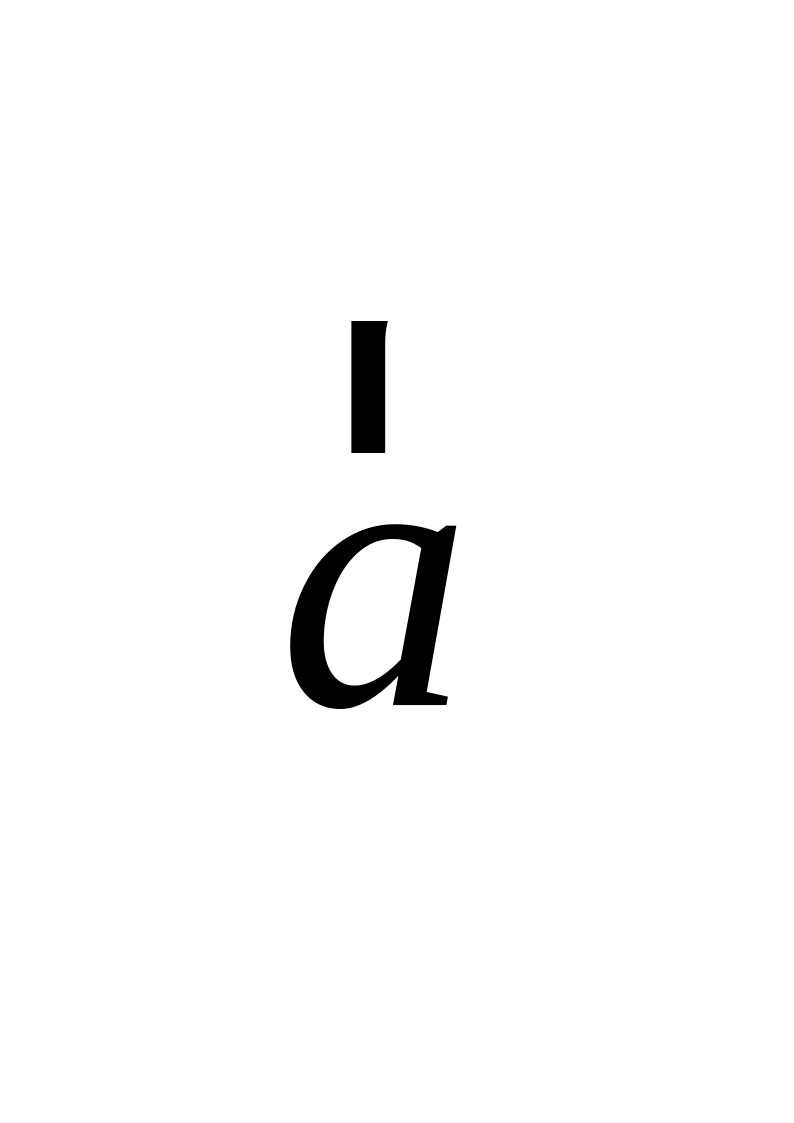
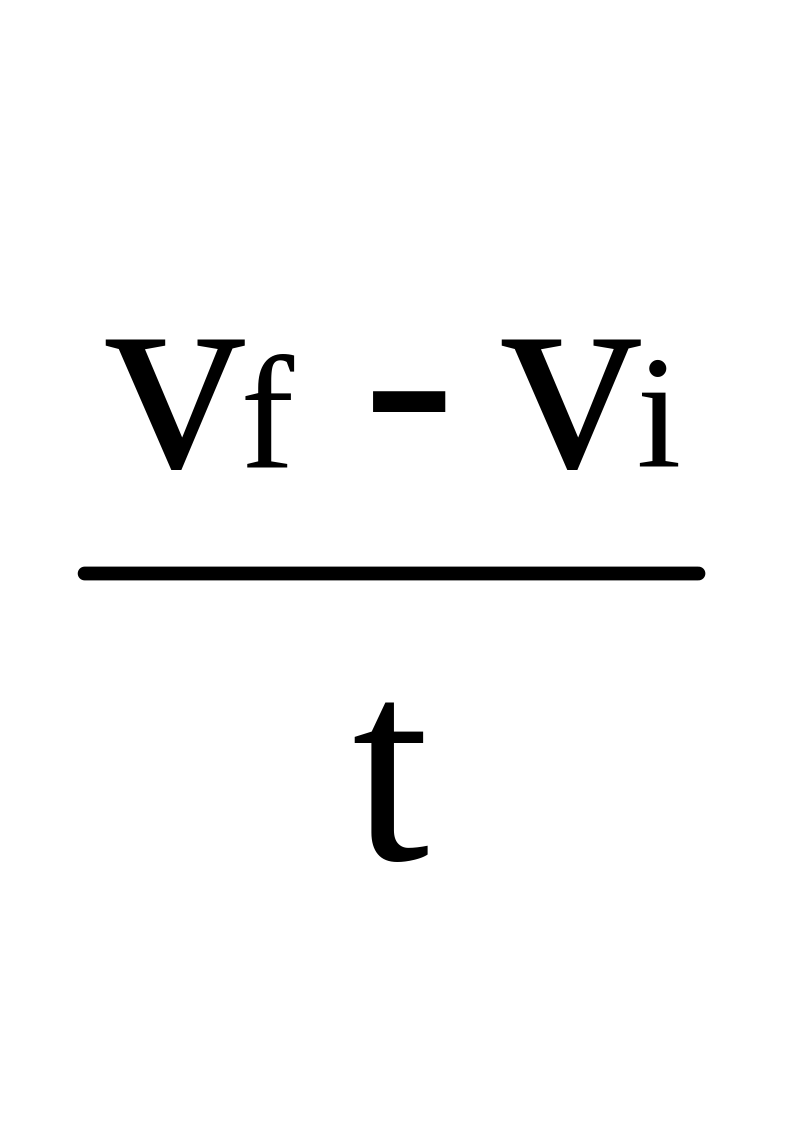
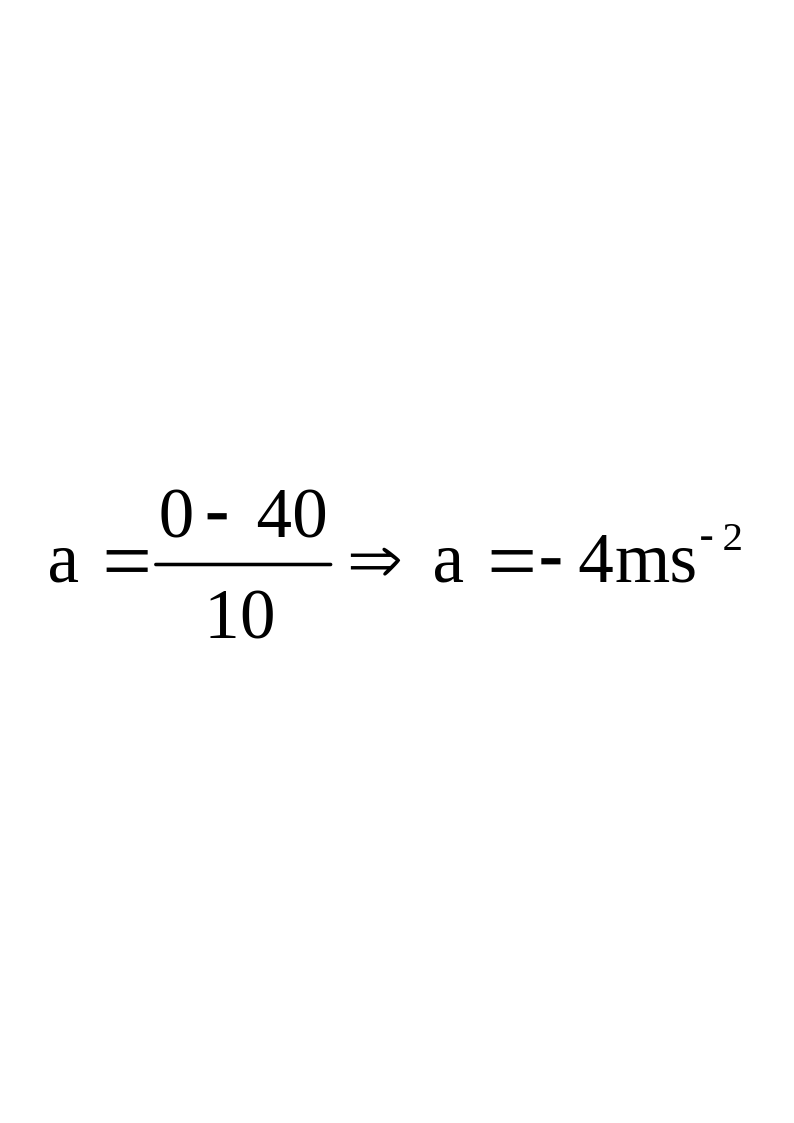
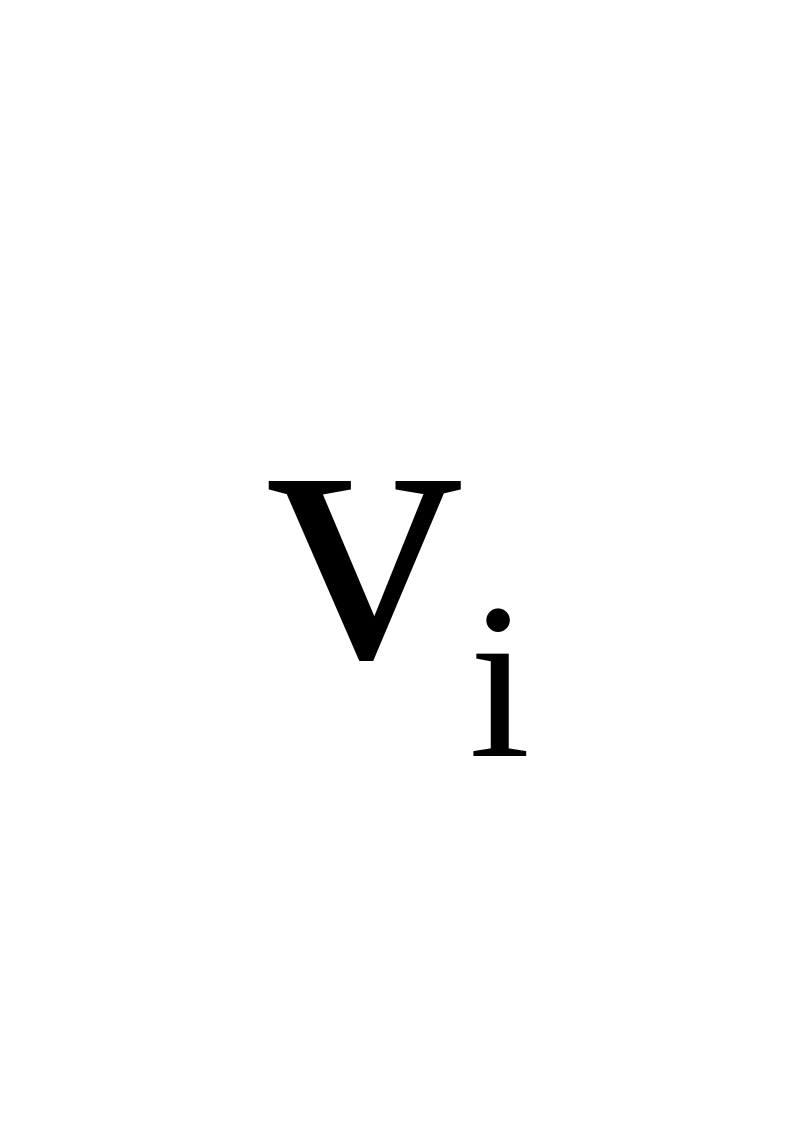
Numerical 6. When brakes are applied Initial velocity = vi = 40ms–1 Final Velocity = vf = 0 Time for being stop = t =10s To Find: (i) Deceleration = – = ? (ii) Distance traveled by the car = S = ? Calculations We know Acceleration = Acceleration = So a = Putting values We can find total distance covered in two steps Step 1 for Uniform Motion: As we know that S = Vav x t By putting the values, we have S = 40 x 5 S = 200 m Step 2 for Deceleration: As we know that S = t + ½ at2 By putting the values, we have S= (40) (10) + ½ (–4)(10)2 S =400–200 S= 200m Total distance travelled during the journey = 200m+200m =400m Result: A train start from rest with an acceleration of 0.5 ms–2. Find its speed in kmh–1, when it has moved through 100 m.
Given Data:
Acceleration of the train = a = 0.5 ms–2
Initial velocity of the train = = 0 ms–1
Distance moved by train = S = 100 m
To Find:
Final speed in kmh–1 = = ?
Calculations:
From third equation of motion, we have
2aS = vf2 – vi2
by putting the values, we have
2 x 0.5 x 100 = vf2 – (0)2
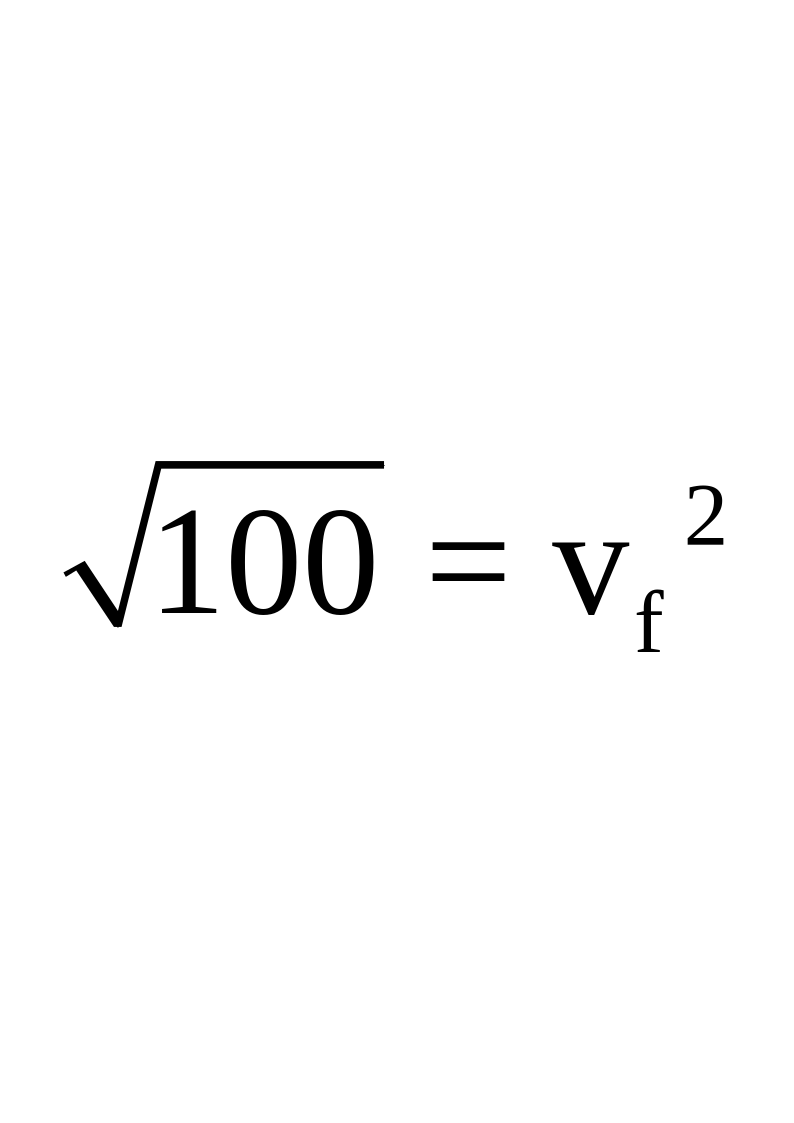
100 = vf2
by taking square root on both sides, we have
So vf = 10 ms–1
Speed In kmh–1
=
Result:
Numerical 7. A train starting from rest accelerates uniformly and attains a velocity 48 kmh–1 in 2 minutes. It travels at speed for 5 minutes. Finally, it moves with uniform retardation and is stopped after 3 minutes. Find the total distance traveled by the train.
Given Data:
Velocity = v = 48 kmh–1
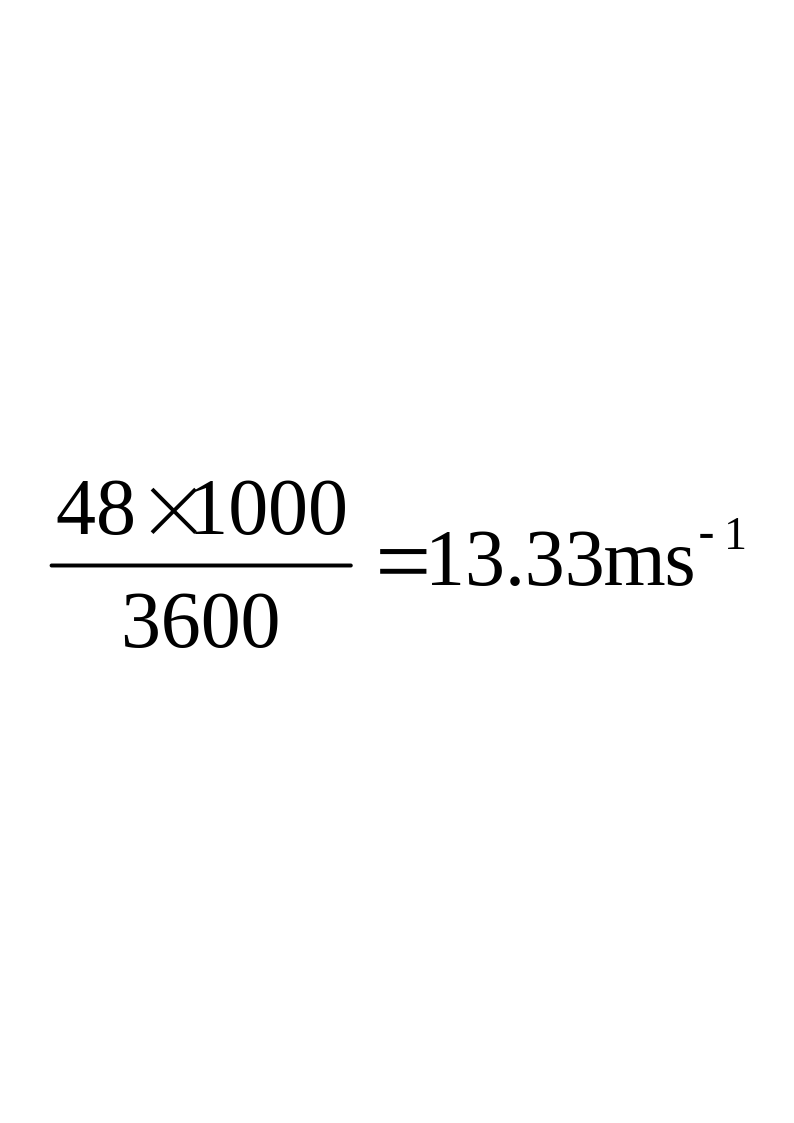
Velocity = v =
Time taken = t = 2 minutes = 2(60) = 120 s
Again time taken = t =5 minutes = 5(60) = 300 s
Again time taken = t= 3 minutes = 3(60) = 180 s
To Find:
Total distance covered= S =?
Calculations:
By using the given values we can plot a graph shown in figure:
We know that area under speed–time graph represents the distance covered by the object.
Total distance covered = Area of trapezium OABC
S (Sum of parallel sides) (Perpendicular distance between parallel sides)
S(600+300) (13.33)
S(900) (13.33)
S= 6000 m
Result:
Numerical 8. A cricket ball is hit vertically upwards and returns to ground 6 s later. Calculate Maximum height, reached by the ball. Initial velocity of the ball.
Given Data:
Final velocity of the ball = = 0 ms–1
Gravitational acceleration = g = –10 ms–2
Time in which ball return to ground = t = 6 s
To Find:
Maximum height reached by ball = h = ?
Initial velocity of the ball = vi = ?
Calculations:
We know that for ball thrown vertically upward in air
Time taken by ball to reach maximum height = Time taken by ball to reach ground from maximum height
time taken by ball to reach maximum height = t = 3 s
From first equation of motion, we have
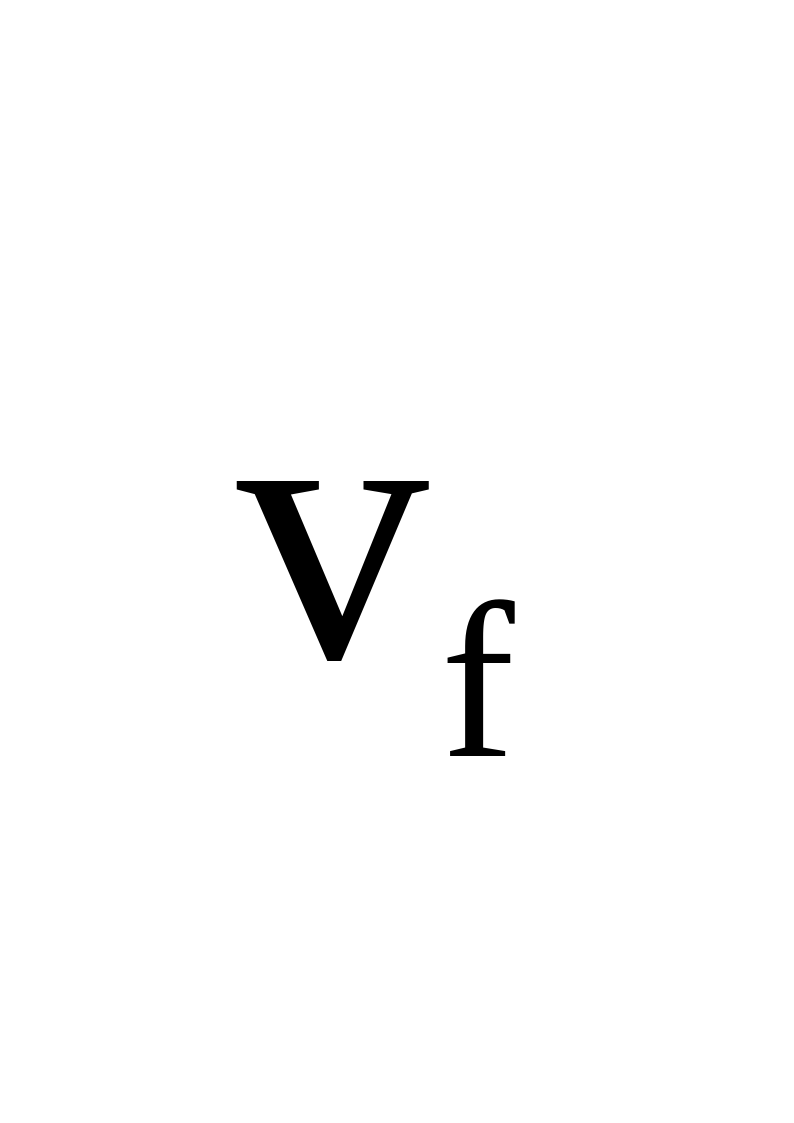
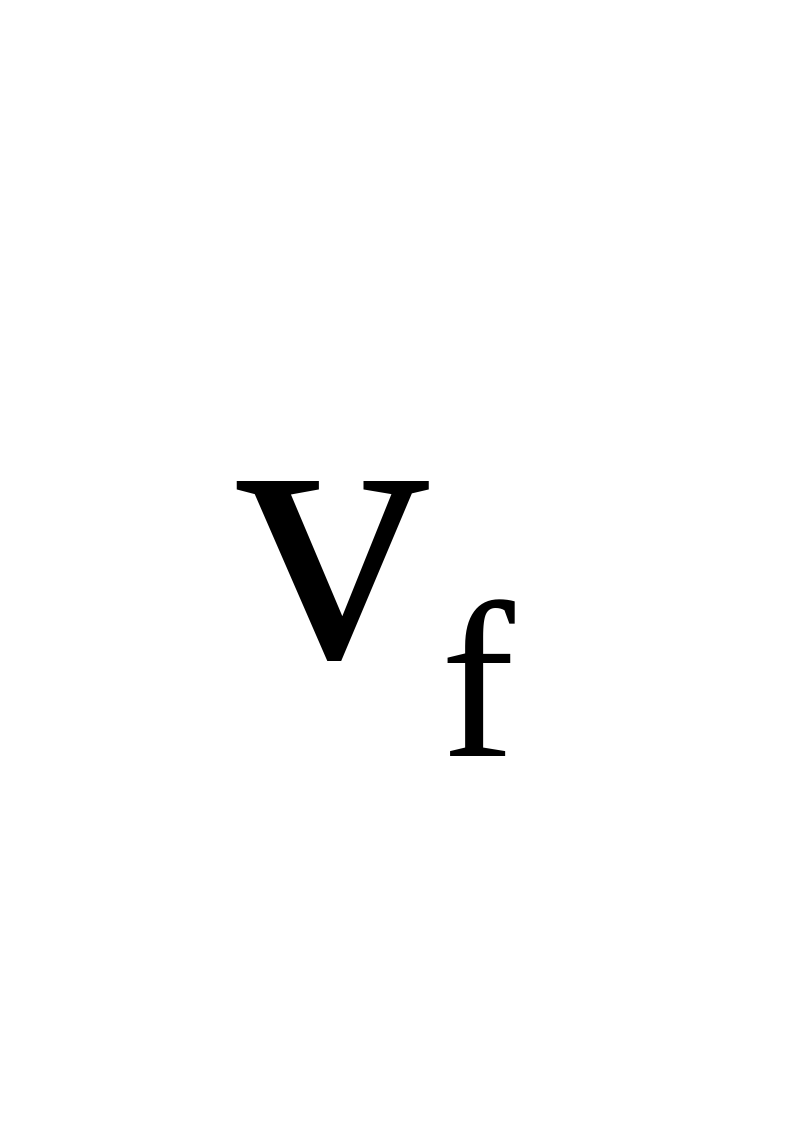
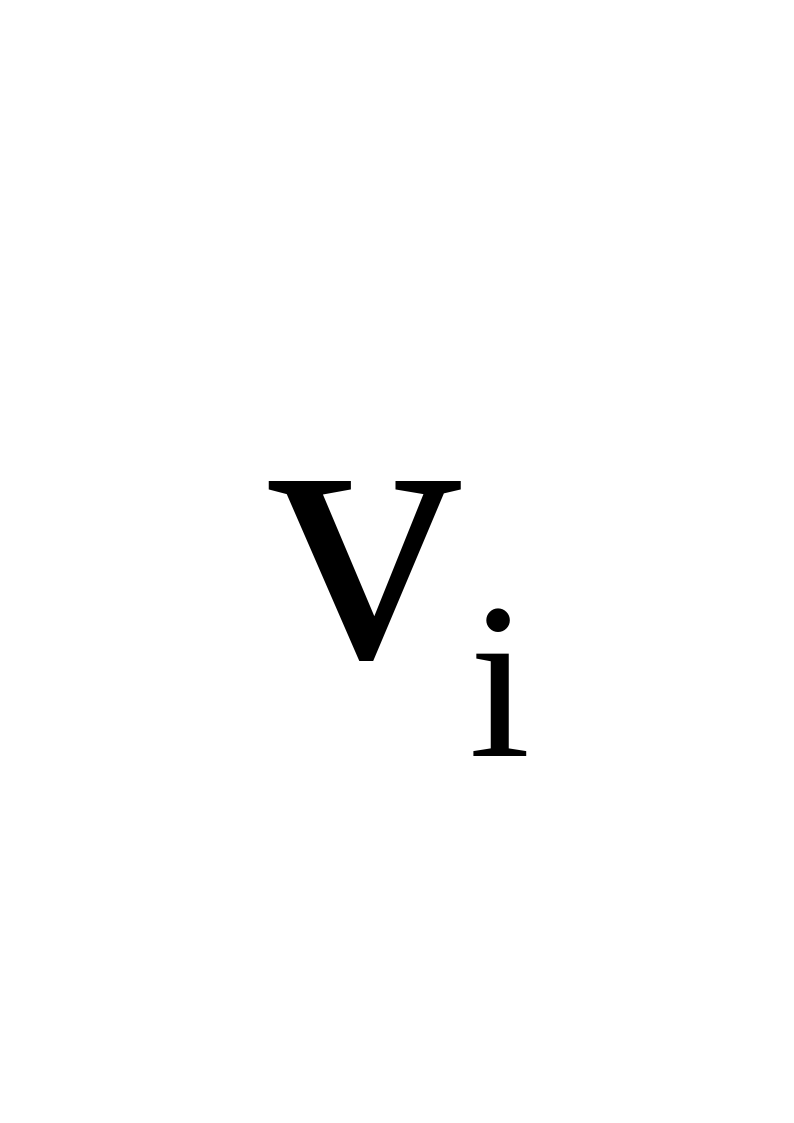
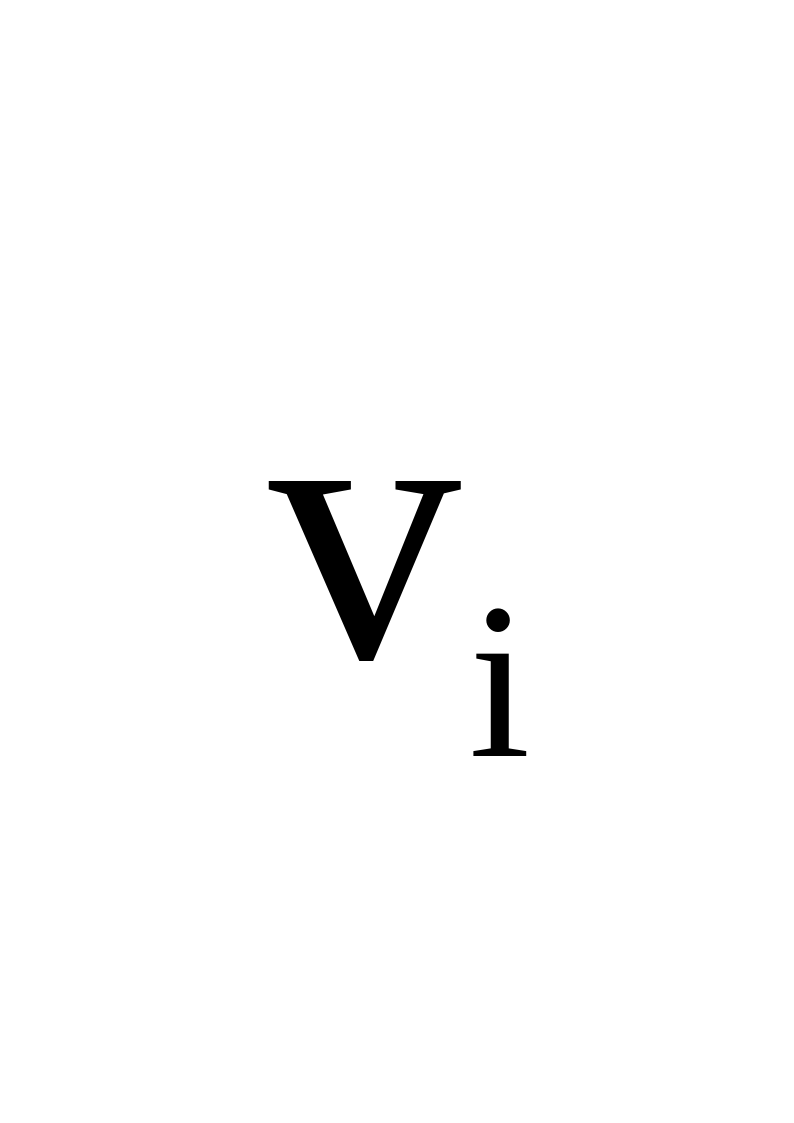
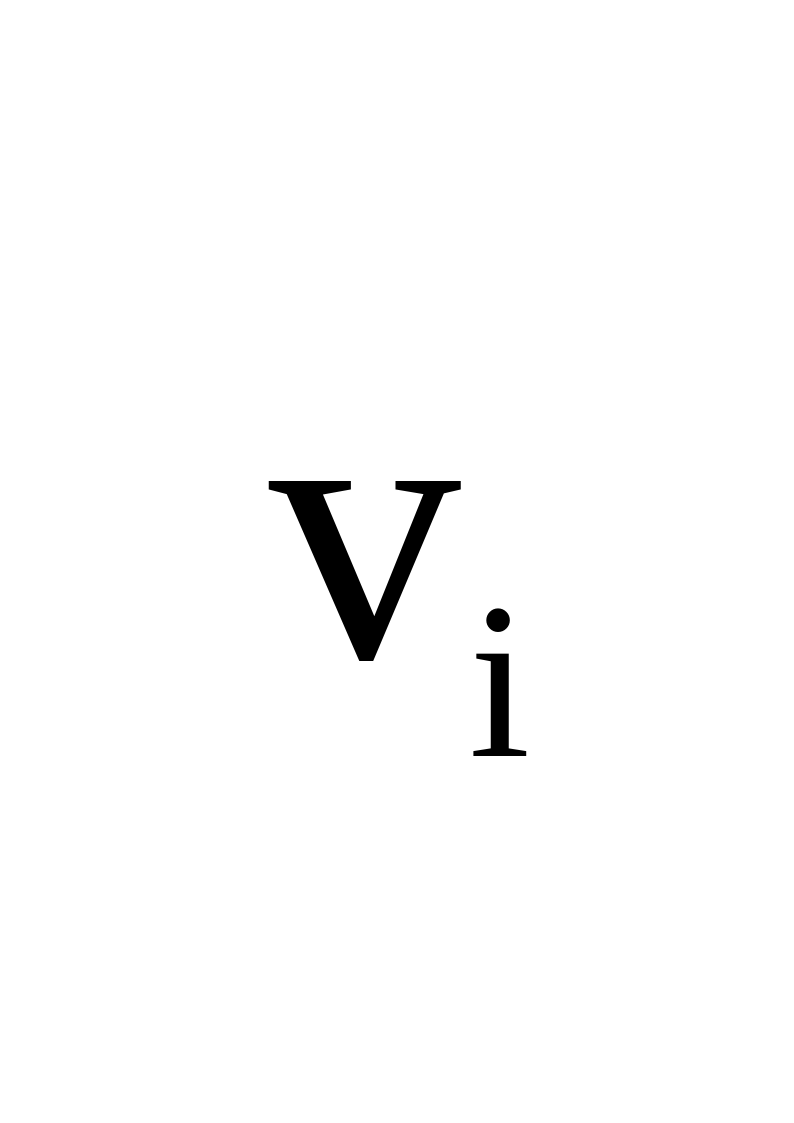
= + gt
By putting the values, we have
0 = + (–10) x 3
0 = –30
So = 30 ms–1
Now from second equation of motion, we have
S = t + ½ gt2
By putting the values, we have
S = 30 x 3 + ½ x (–10) x (3)2
S = 90 – 5 x 9
S = 45 m
Result:
Numerical 9. When brakes are applied, the speed of a train decreases from 96 kmh–1 to 48 kmh–1 in 800 m. How much further will the train move before coming to rest? (Assuming the retardation to be constant)
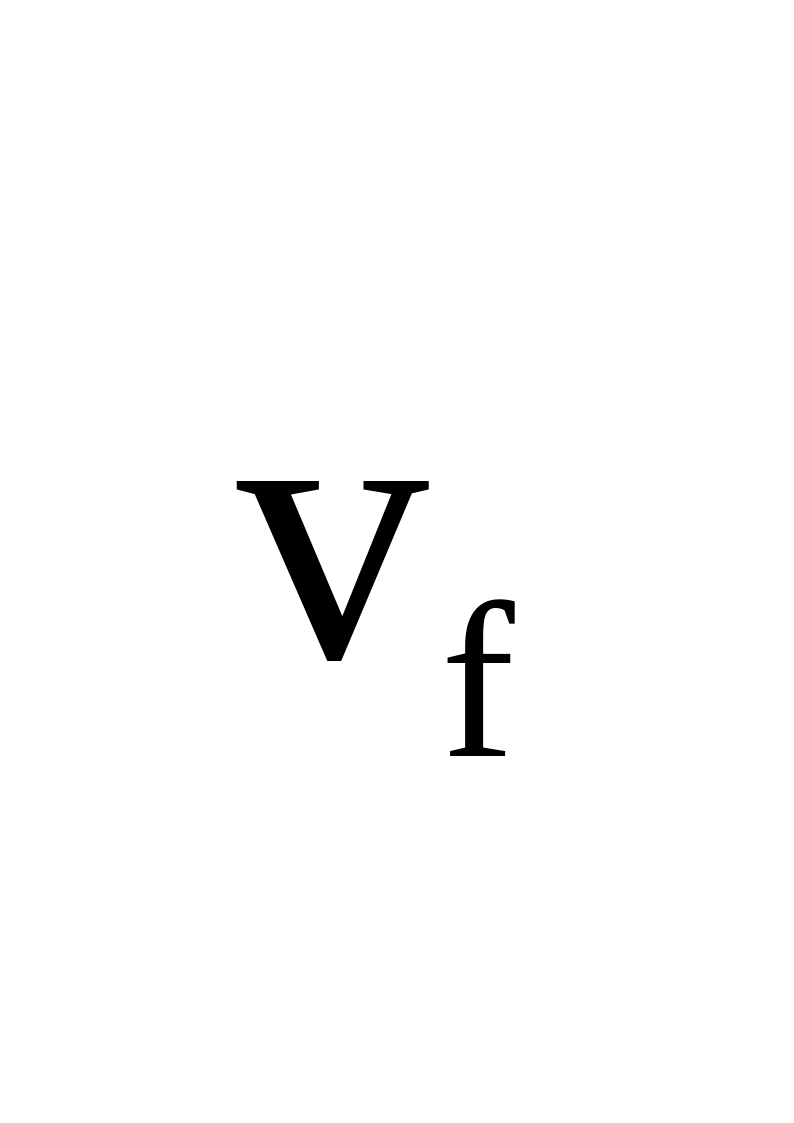
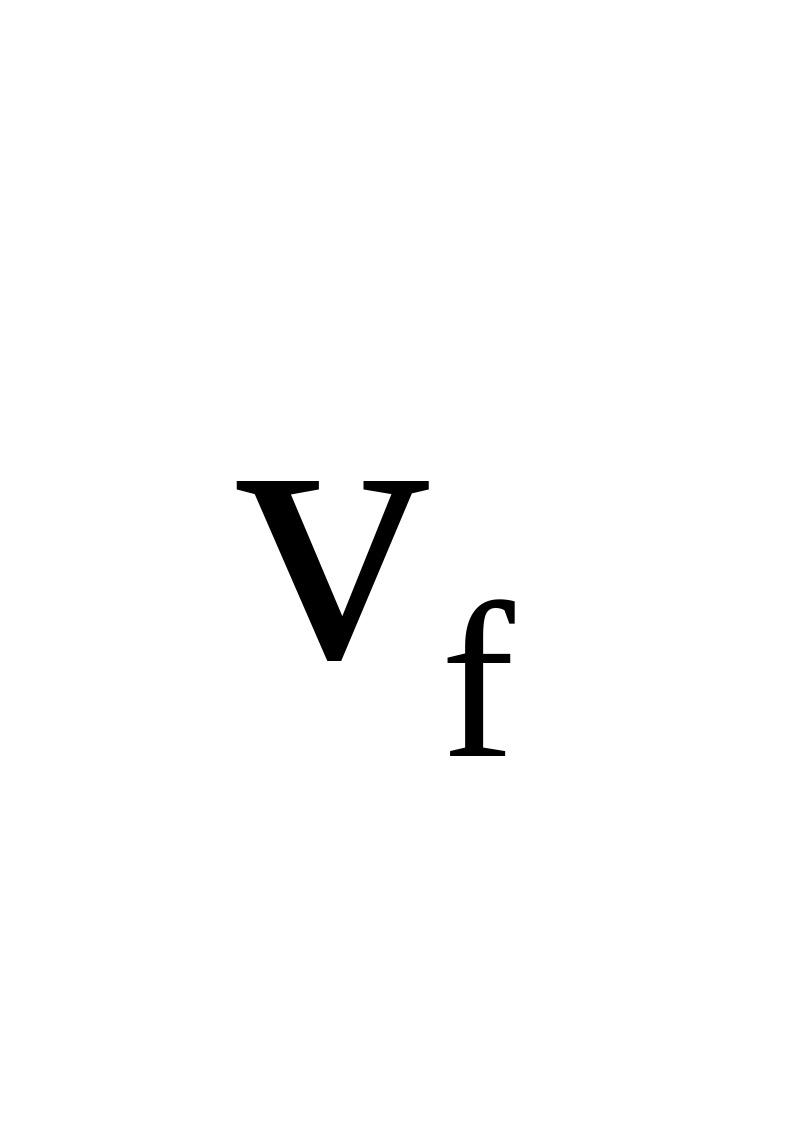
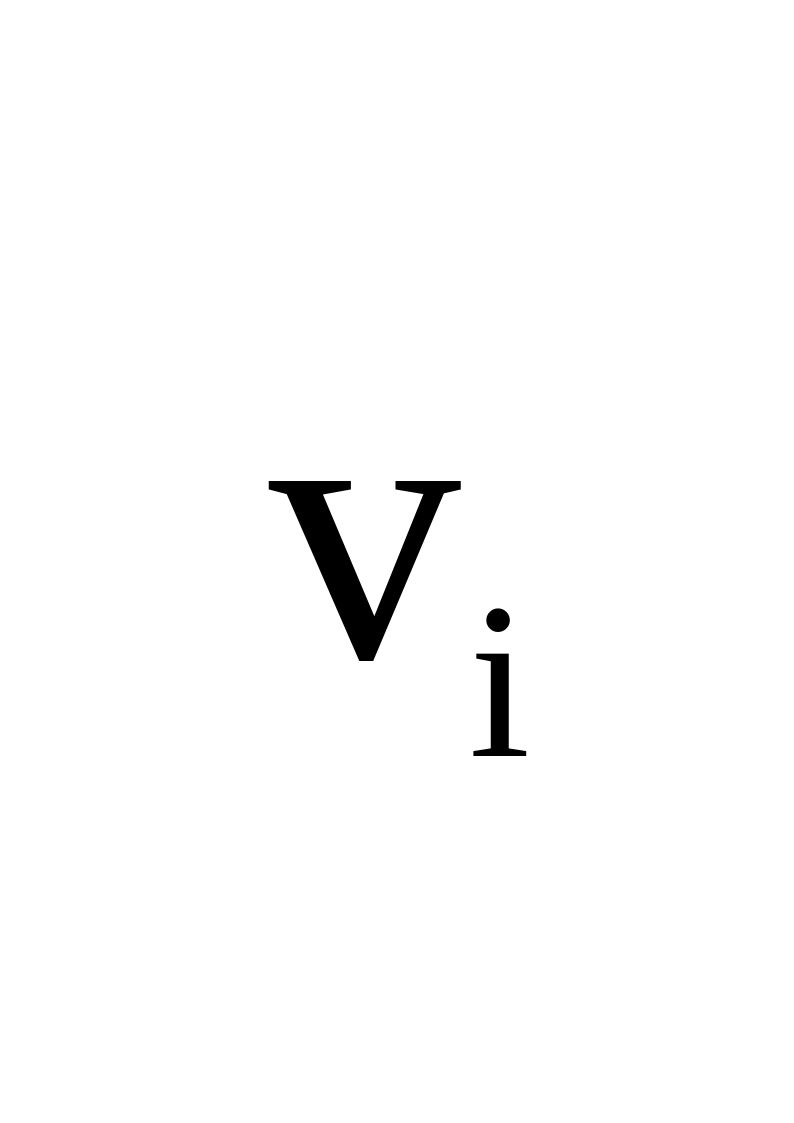
Given Data :
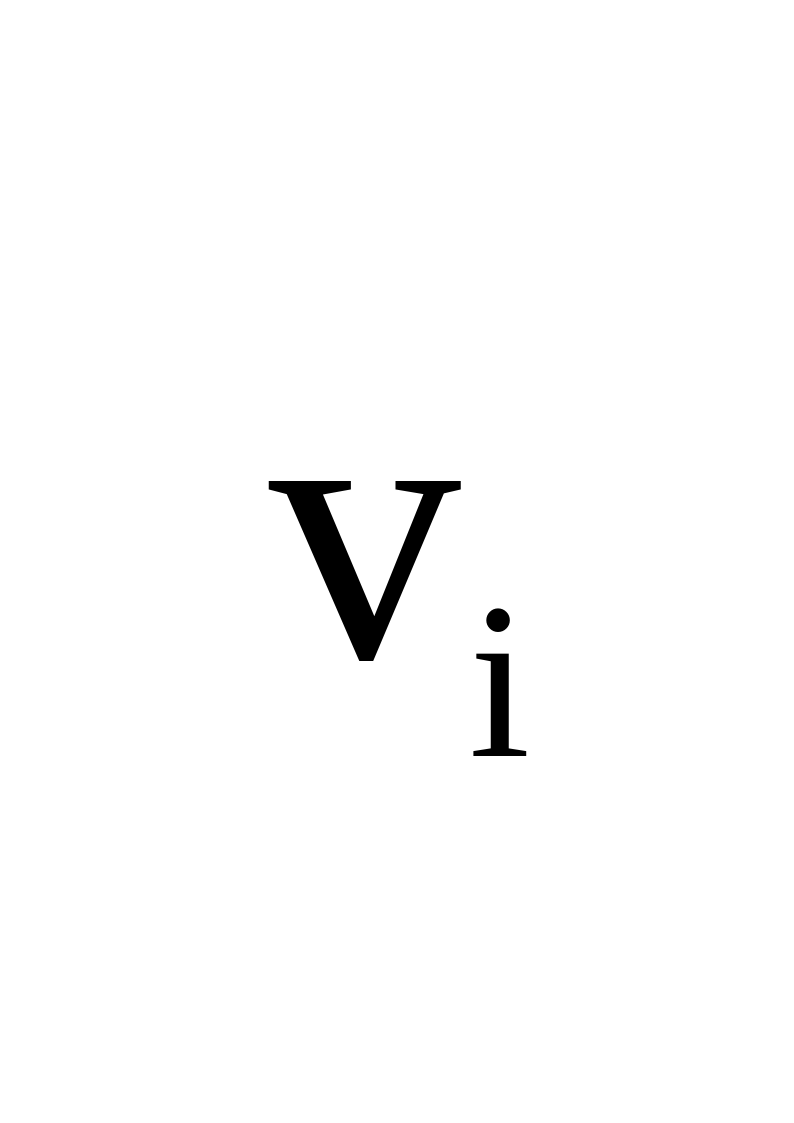
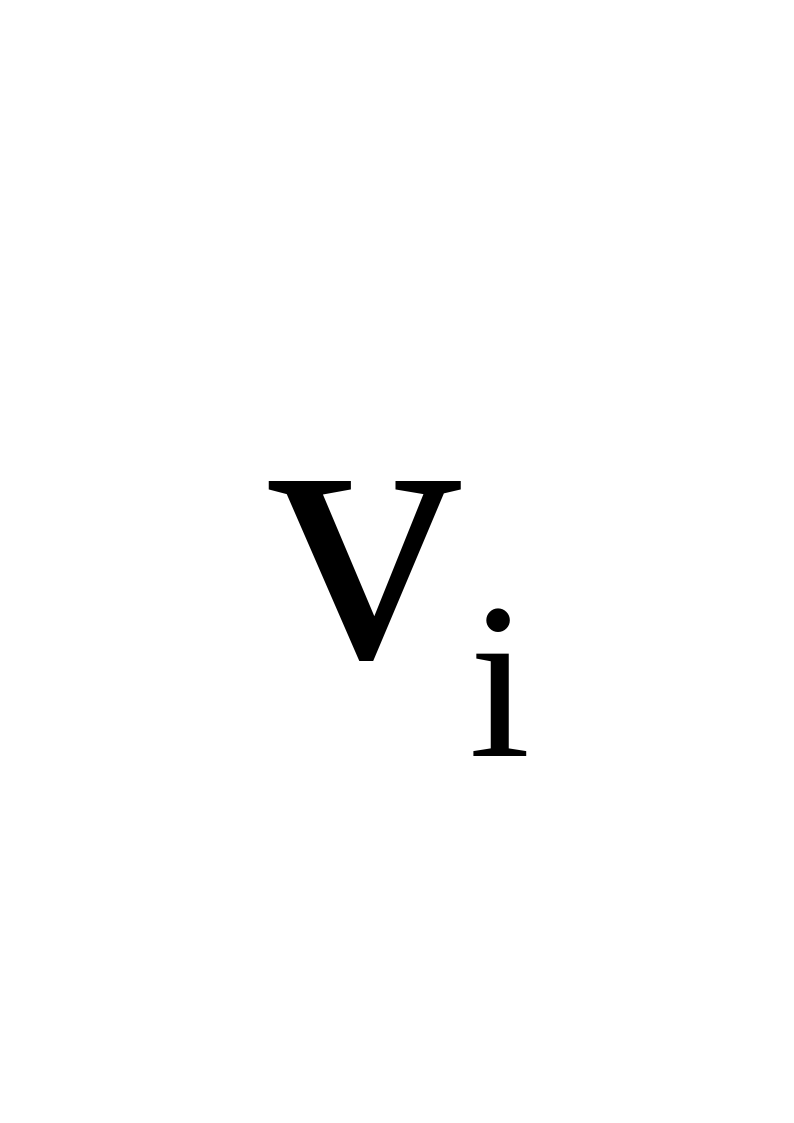
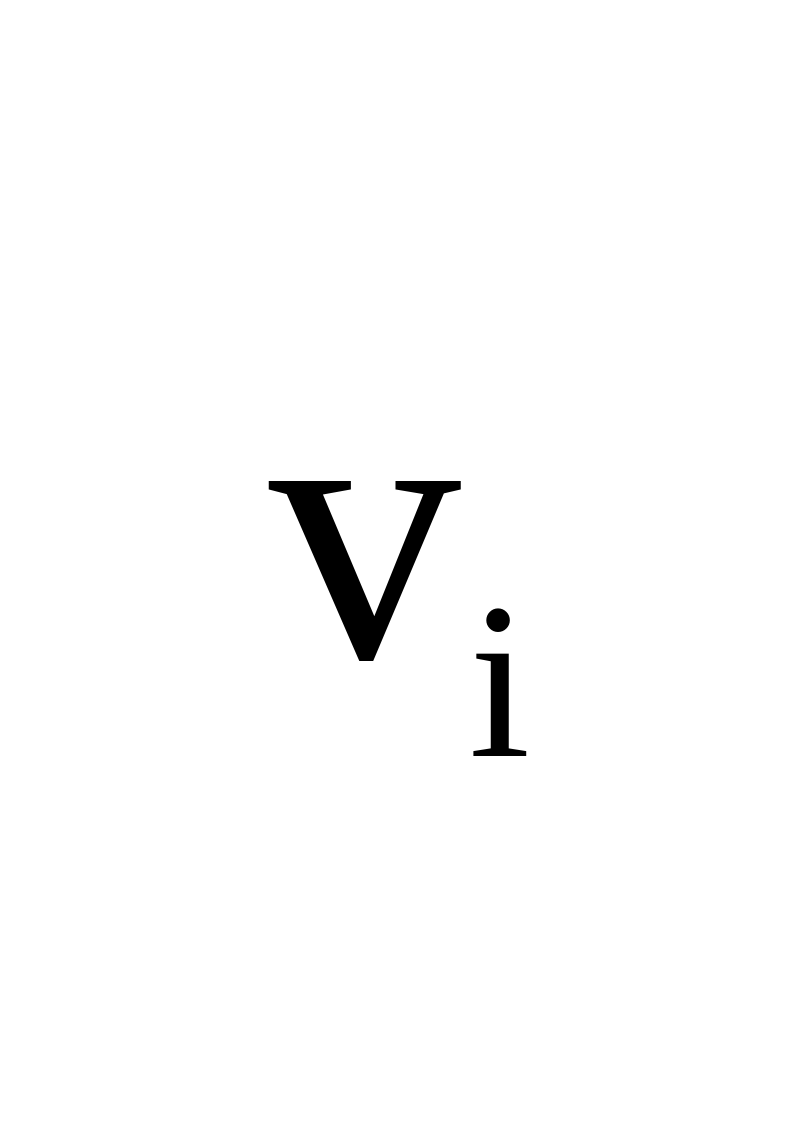
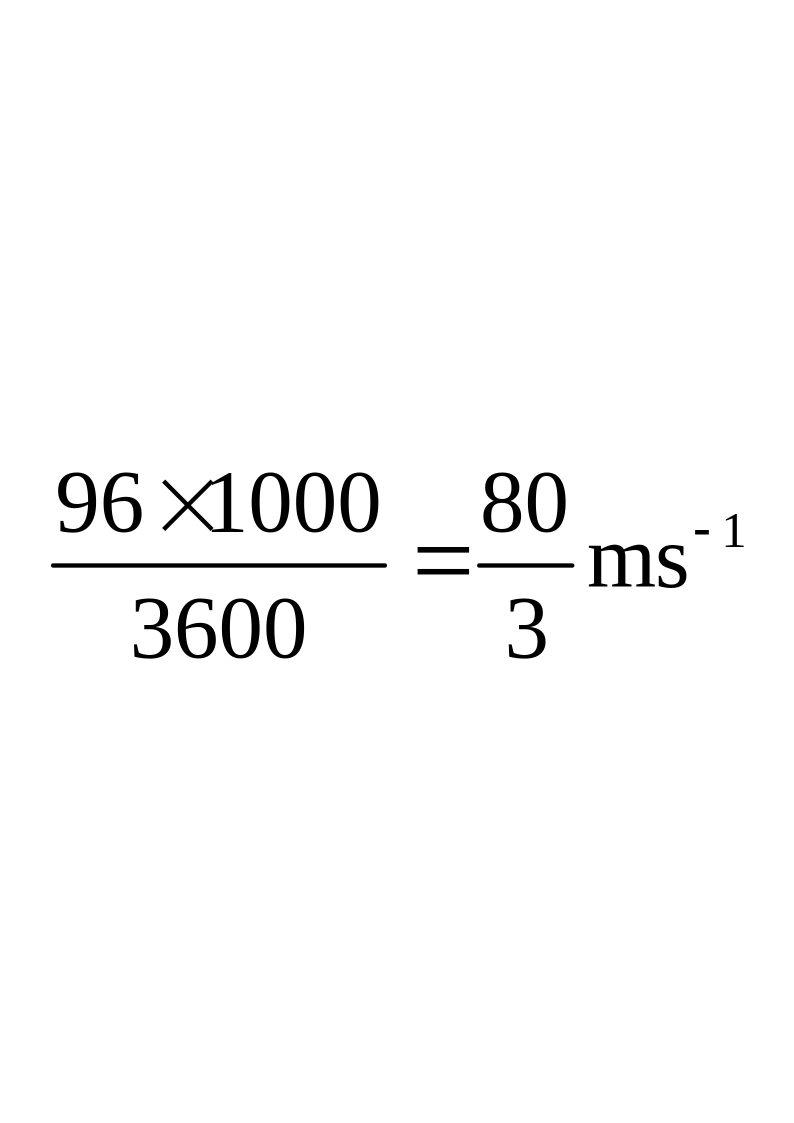
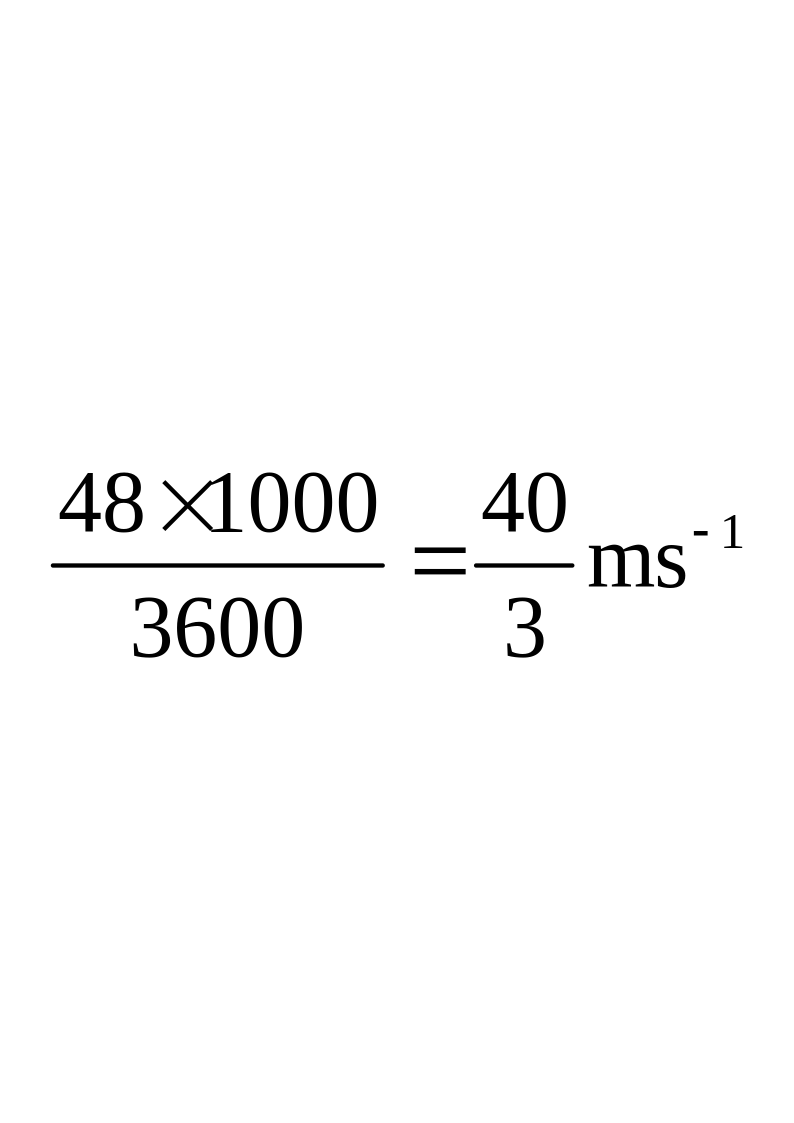
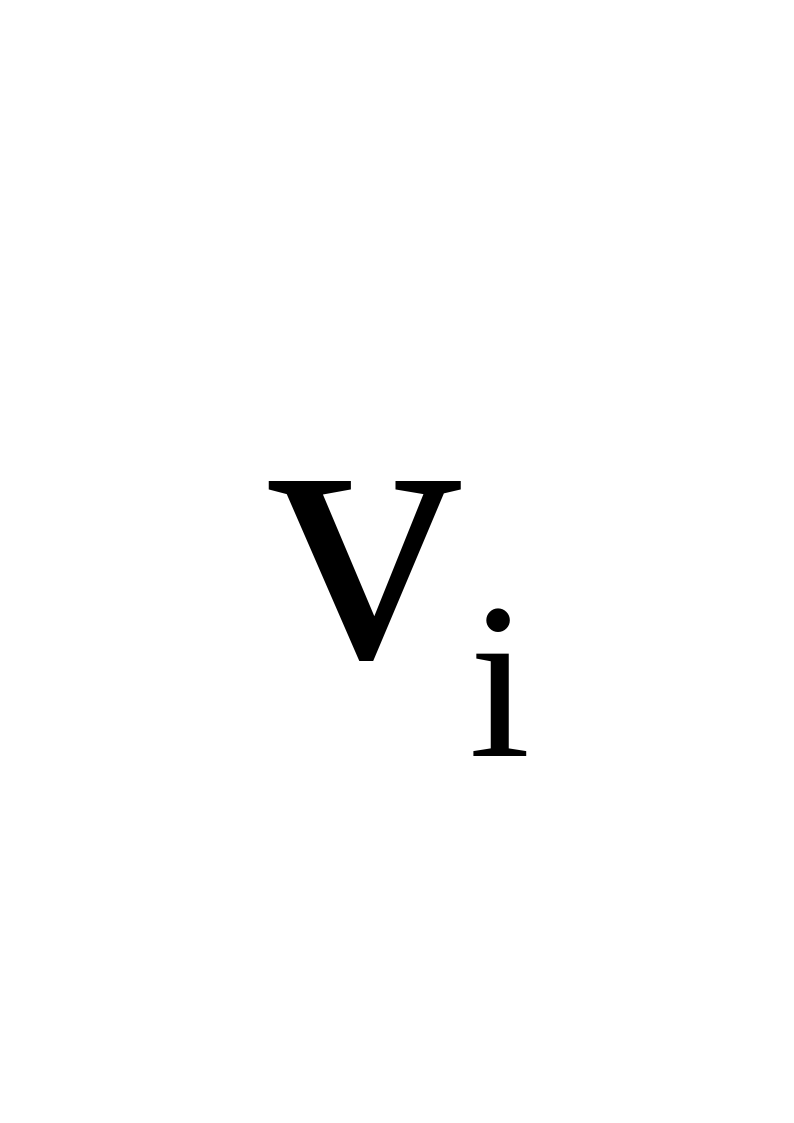
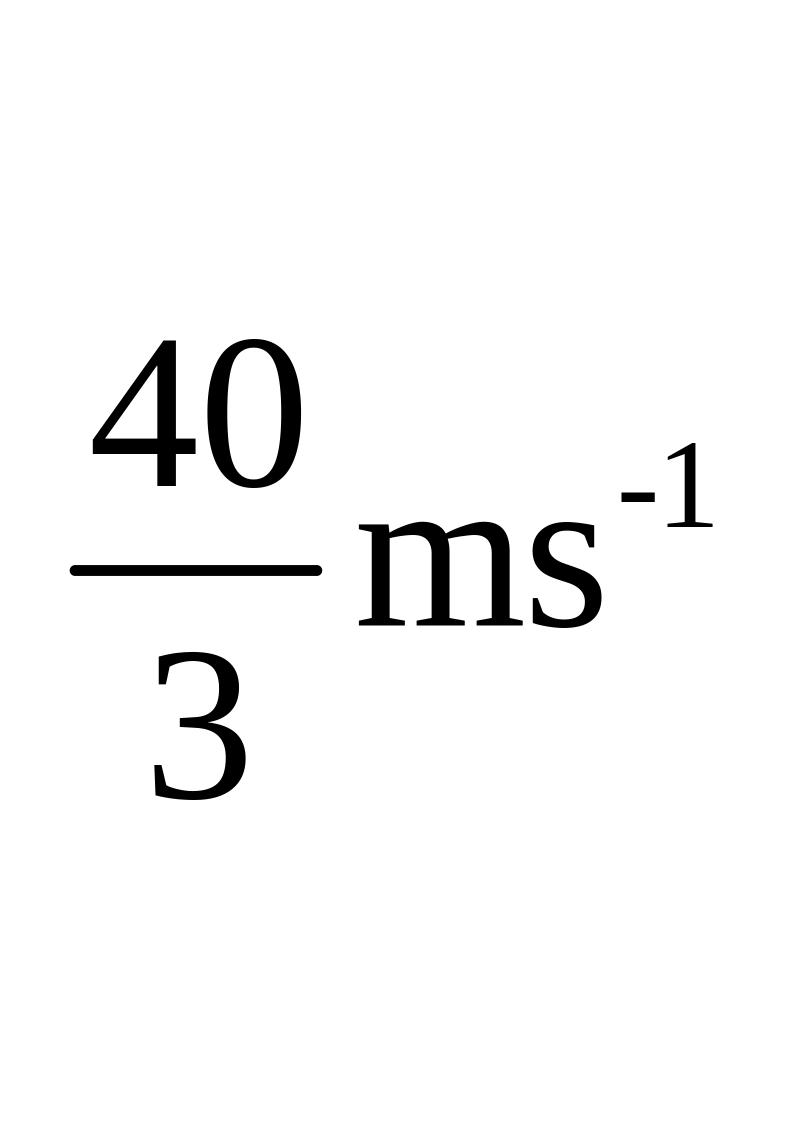
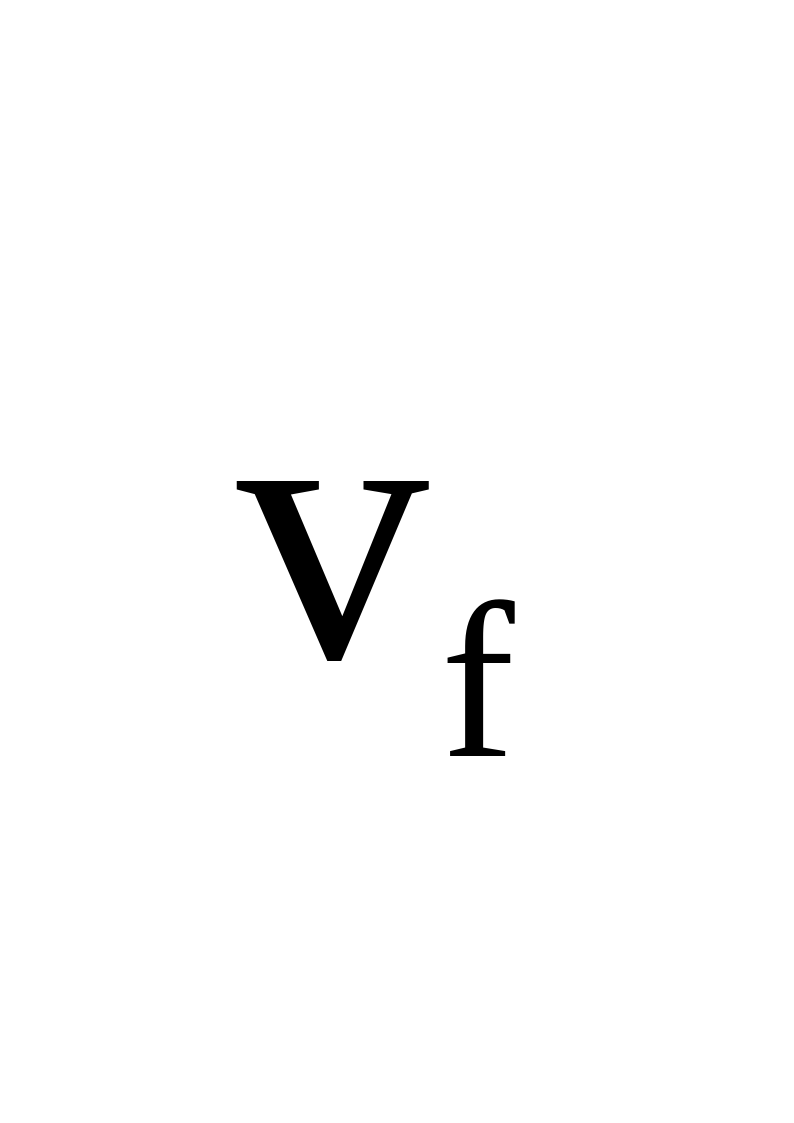
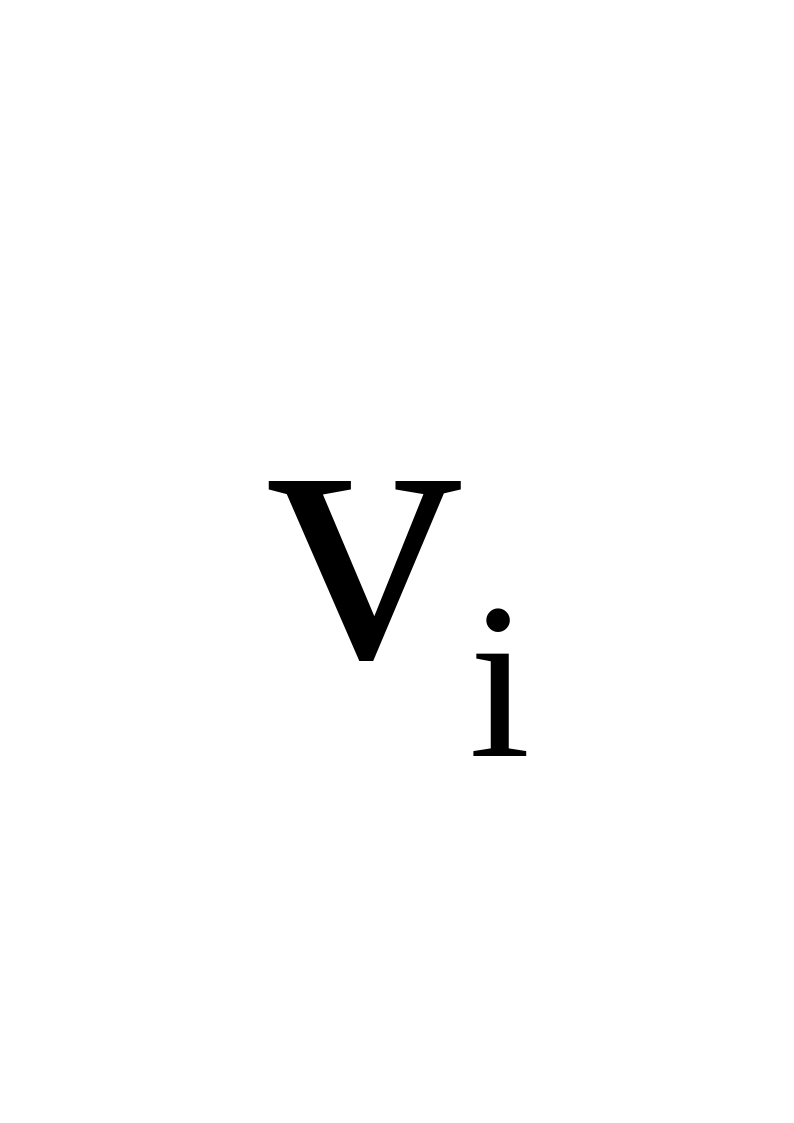
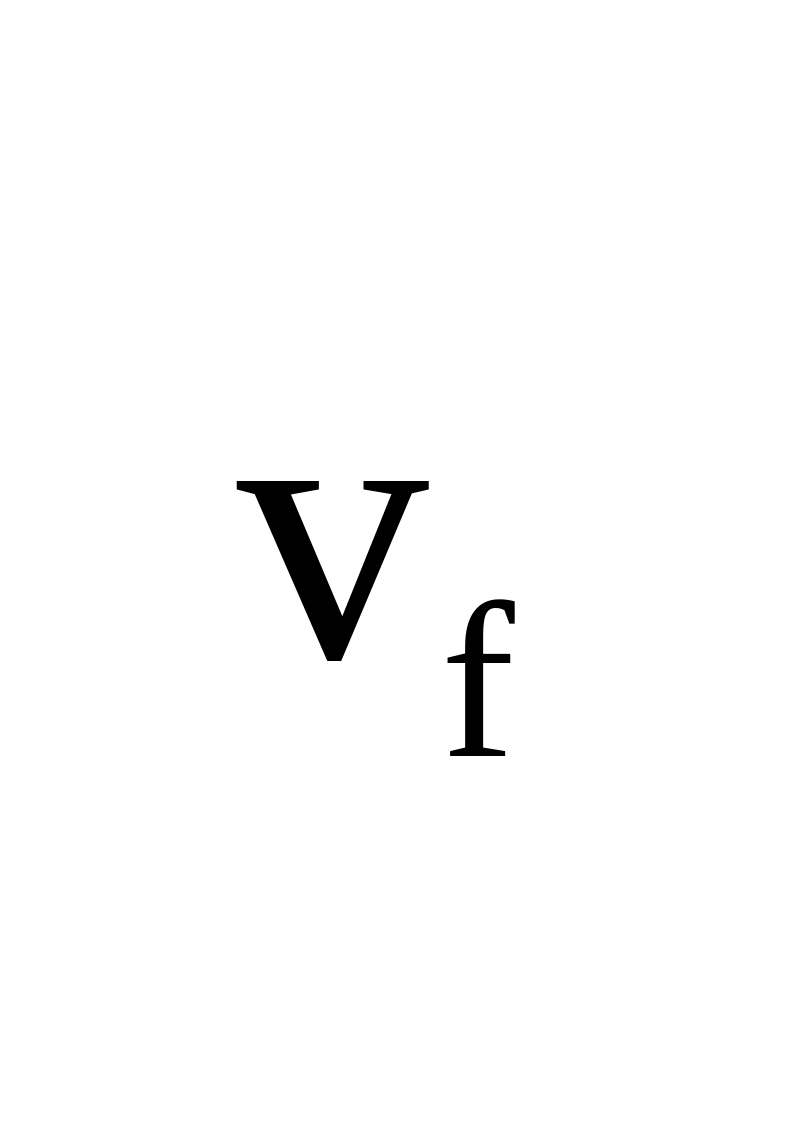
Initial velocity of train = = 96 kmh–1 = =26.67ms–1
Final velocity of train = = 48 kmh–1 = = 13.33ms–1
Distance covered by train = 800 m
To Find:
Distance covered by the train before coming to rest = S = ?
Calculations:
First we have to find
Retardation of the train = –a = ?
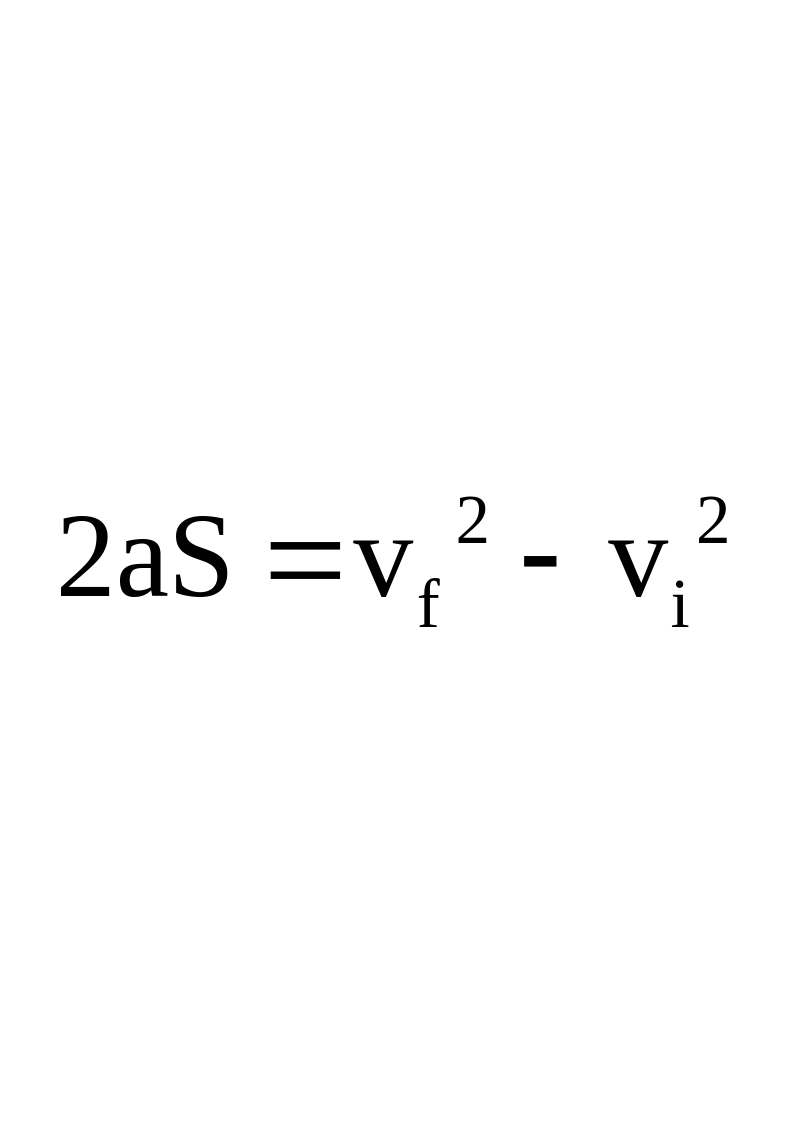
From third equation of motion, we have
By putting the values, we have
2 a (800) = (13.33)2 – (26.67)2
1600 a = 177.69 – 711.29
1600 a = –533.6
a = – 533.6 / 1600
a = – 0.33 ms–2
Again For over all motion till trains stops
Initial velocity of train = = 48 kmh–1 = = 13.33ms–1
Final velocity of train = = 0 ms–1
Retardation of train = a = – 0.333 ms–2
Numerical 10. From third equation of motion, we have By putting the values, we have 2 (–0.333) S = (0)2 – (13.33)2 –0.66 6S = – (177.69) S = 177.69/0.66 S= 266.8 m Result: In the above problem, find the time taken by the train to stop after the application of the brakes.
Given Data:
Initial velocity of train = = 96 kmh–1 = =26.67ms–1
Final velocity of train = = 0 ms–1
Acceleration = a = –0.333ms–2
To Find:
Time taken by the train = t = ?
Calculations:
From first equation of motion, we have
= + at
By putting the values, we have
0 = 26.67 + (–0.333) t
–26.67 = – (0.333) t
t = 26.67/ 0.333
t = 80s
Result:
TB.ST Self Test
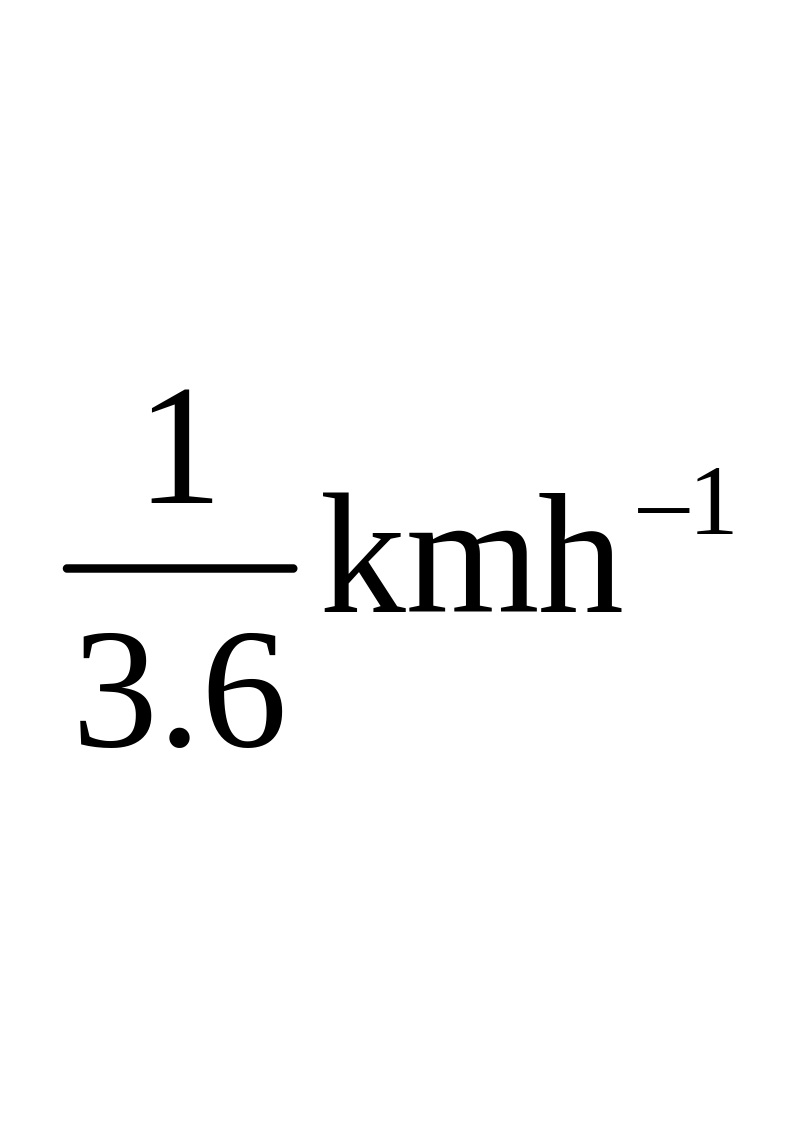
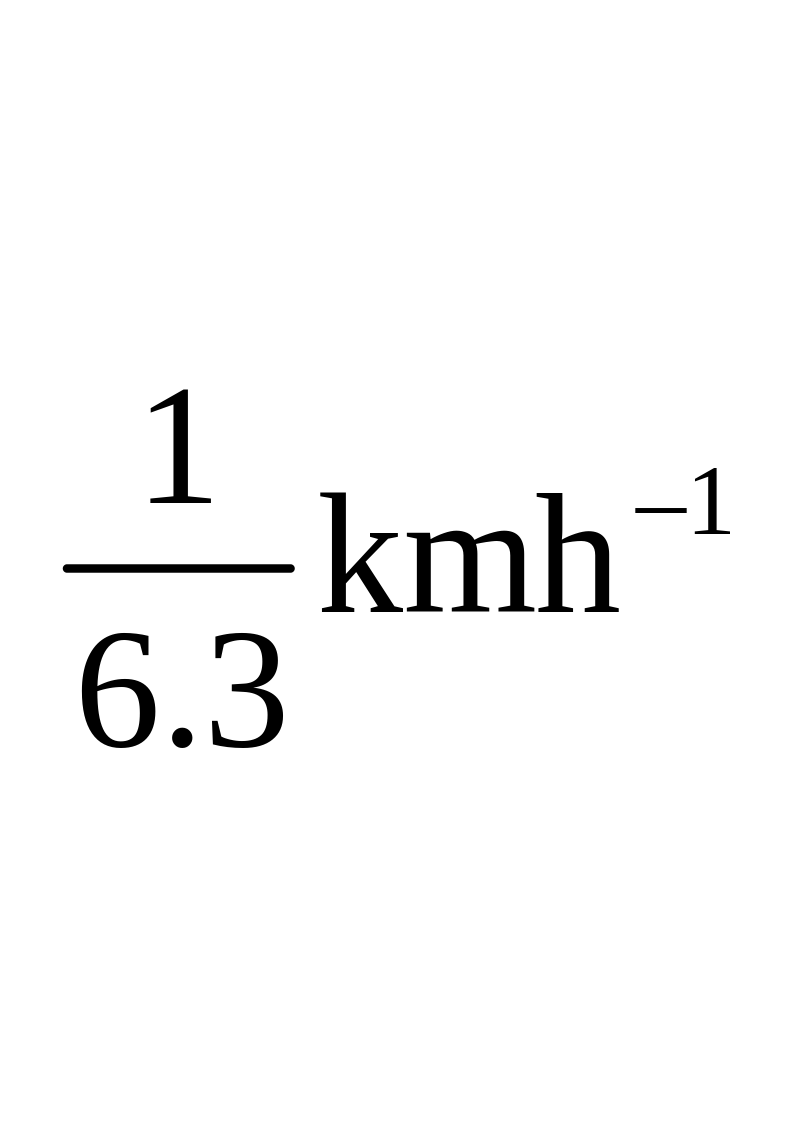
Long Questions
Q1. Define gravitational acceleration. Write a note on the motion of freely falling bodies.
Q2. A stone is dropped from the top of a tower. The stone hits the ground after 5 seconds. Find:
Q3. The height of the tower
Q4. The velocity with which the stone hits the ground
Q5. Note:
Q6. Parents or guardians can conduct this test in their supervision in order to check the skill of students.
Short Questions
Q1. A truck covers a distance of 360 km in 5 hours. Find its speed in metre per second.
Q2. A body is moving with uniform velocity. What will be its acceleration?
Q3. Under what conditions the distance and displacement between two points will be equal?
Q4. Can a body moving at a constant speed have acceleration?
Q5. Find the retardation produced, when a car moving at the speed of 30ms–1 slows down uniformly to 15 ms–1 in 5s.